Product Overview
Eamli is a decision-intelligence platform that empowers organisations to fully leverage their data and make more informed decisions. Using Eamli, organisations can build data models effortlessly and analyse any number of decisions and outcomes, enabling users to see the full range of possibilities that may impact their organisation in real-time.
The Opportunity
Data dashboards are a staple in modern-day analytics software. They help decision-makers quickly understand their organisation at a glance and find the answers to their most crucial questions. However, every organisation is unique and requires something different to meet its decision-making needs. That is why our objective for this project was to provide a dashboard and charting solution that can be customised to meet the needs of any organisation, allowing organisations to leverage their data to its fullest potential!
Before the start of this project, a dashboard and charting solution had previously been created by our development team. However, it was done so without the input of users or UX Designers. Although this was less than ideal, it was a necessary step to make sure other parts of the product were functioning properly. However, we knew we needed to improve the user experience and make it more user-friendly at a later stage, and that's exactly what we did during this project.
My Role
Research
User Testing
User Journey Design
Wireframe Design
UI & UX Design
Product QA
My Approach
Discovery & Exploration
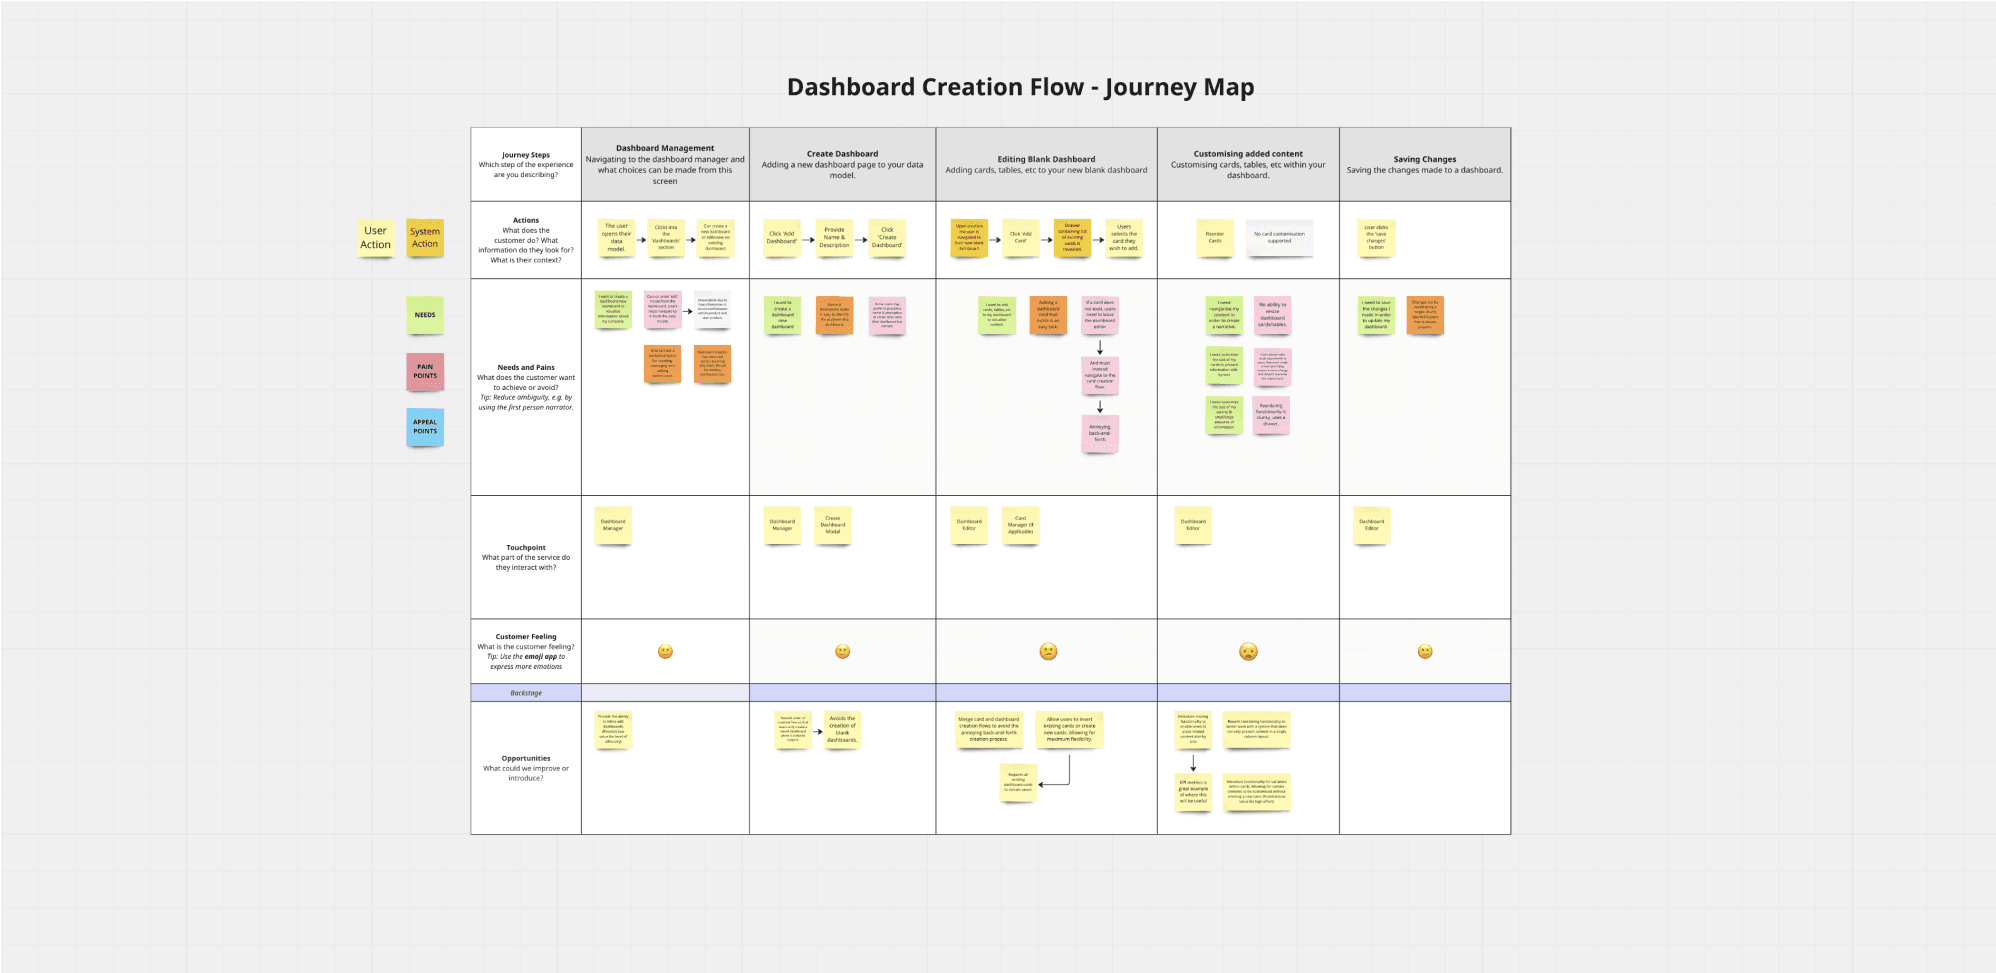
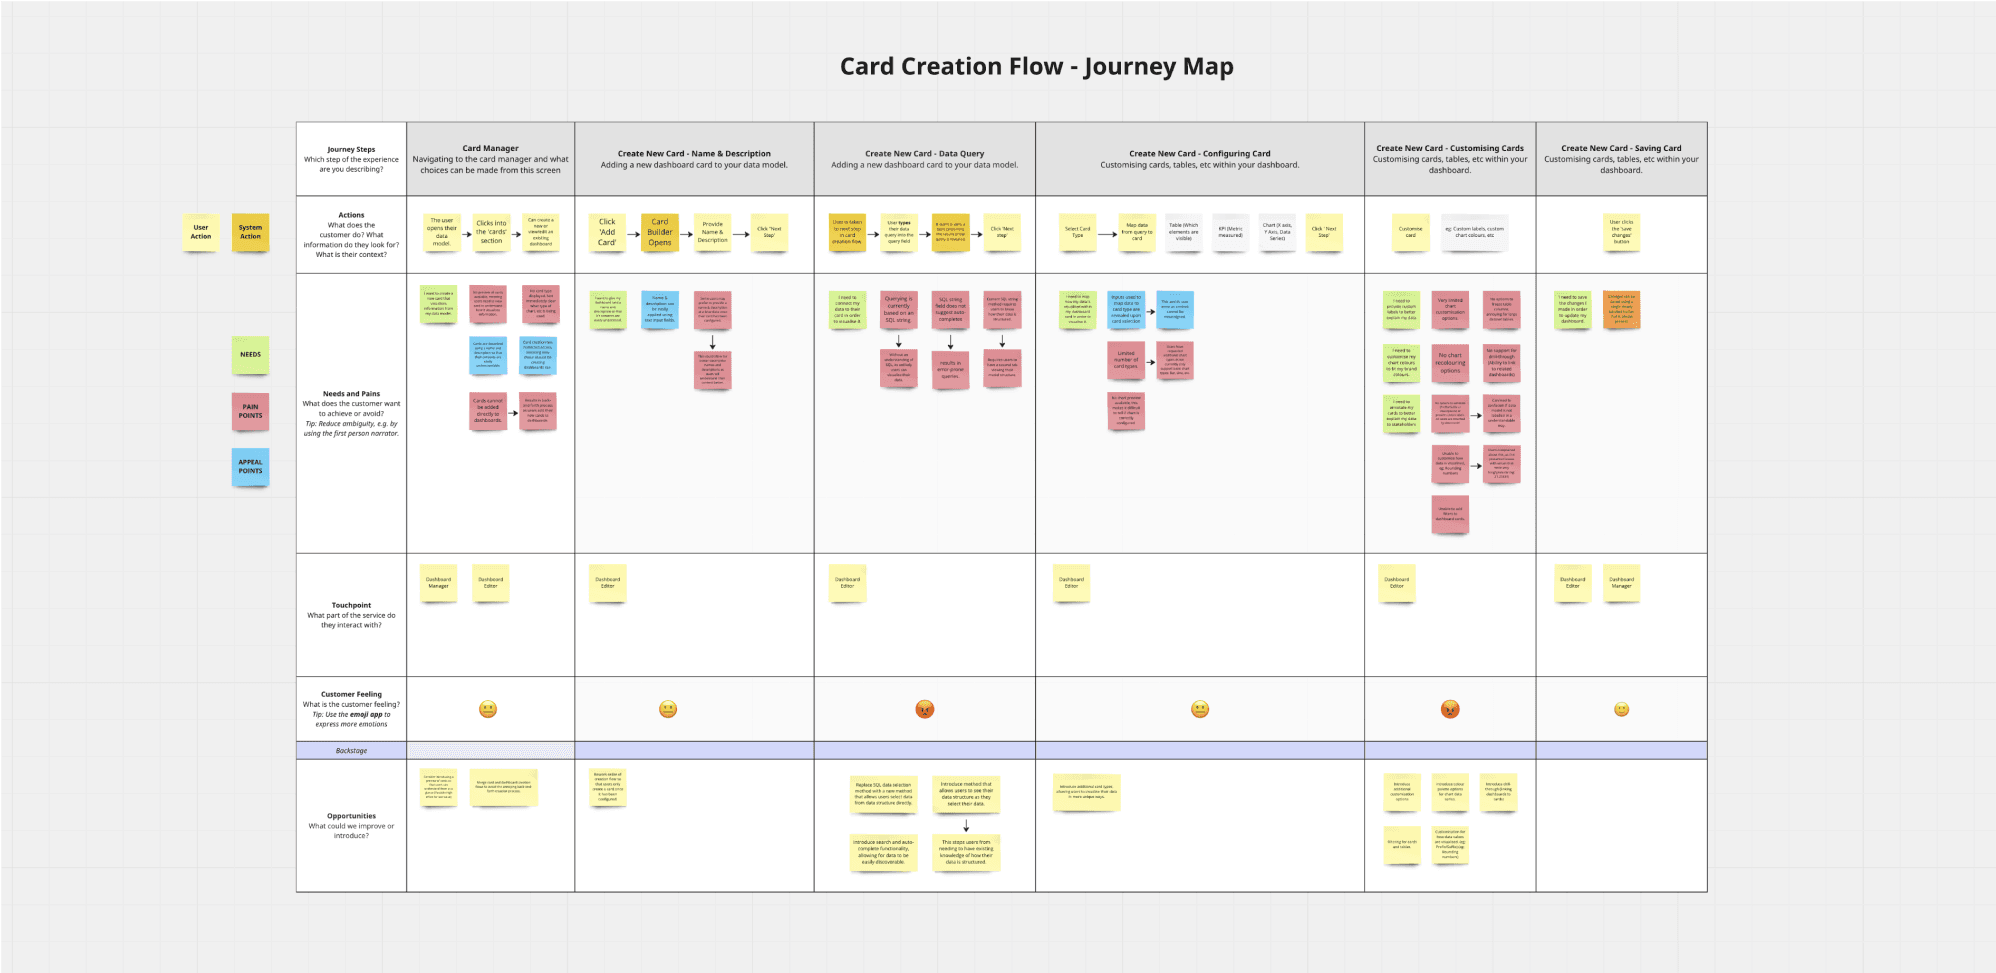
To kick off the design process, I started by defining the problem we needed to solve. To achieve this my team and I interviewed key stakeholders and data modellers using our existing dashboard and charting solution. Using the insights they provided, we produced a customer journey map that helped us gain a deeper understanding of the needs and pains of our user base when attempting to tackle this problem with existing tools, as well as the following:
How are modellers currently using the existing dashboard and card creation flow?
What problems are modellers experiencing when using the current solution? and what work-arounds are they using to resolve these issues?
Do modellers need to rely on other tools to complete their workflow? If so, what tasks are they unable to complete using Eamli?
What features and capabilities do modellers wish the current solution supported?
How do modellers share their findings with stakeholders? and what kind of information do stakeholders expect from modellers?
The research from our journey mapping session was fairly conclusive, helping our team identify 3 critical pain points/challenges:
Fragmented Card & Dashboard Creation Flow — Under the current solution, cards and dashboards are created separately from one another, resulting in a tedious back-and-forth process that many find irritating.
Limited Visualisations & Customisation Options — Many users find the current solution restrictive due to a limited number of visualisation types and customisation options. This became particularly annoying for some modellers working with datasets that were not clearly labelled, as customisation options are required to fully explain the contents of their dashboard cards.
No support for resizing dashboard contents — Users have expressed frustration at the inability to resize dashboard contents. This is especially problematic when presenting multiple visualisations that benefit from being presented side-by-side.
In response to the identified pain points, the design team decided to completely overhaul our existing solution. Together, we compiled a list of objectives that would form the basis of a PoC (Proof of Concept):
Single Creation Flow — Merge the card and dashboard creation flows into a single, comprehensive dashboard builder, eliminating the painful back-and-forth process.
Expand visualisation and customisation options — Add additional visualisation types and introduce customisation options that allow users to better explain the contents of a dashboard card
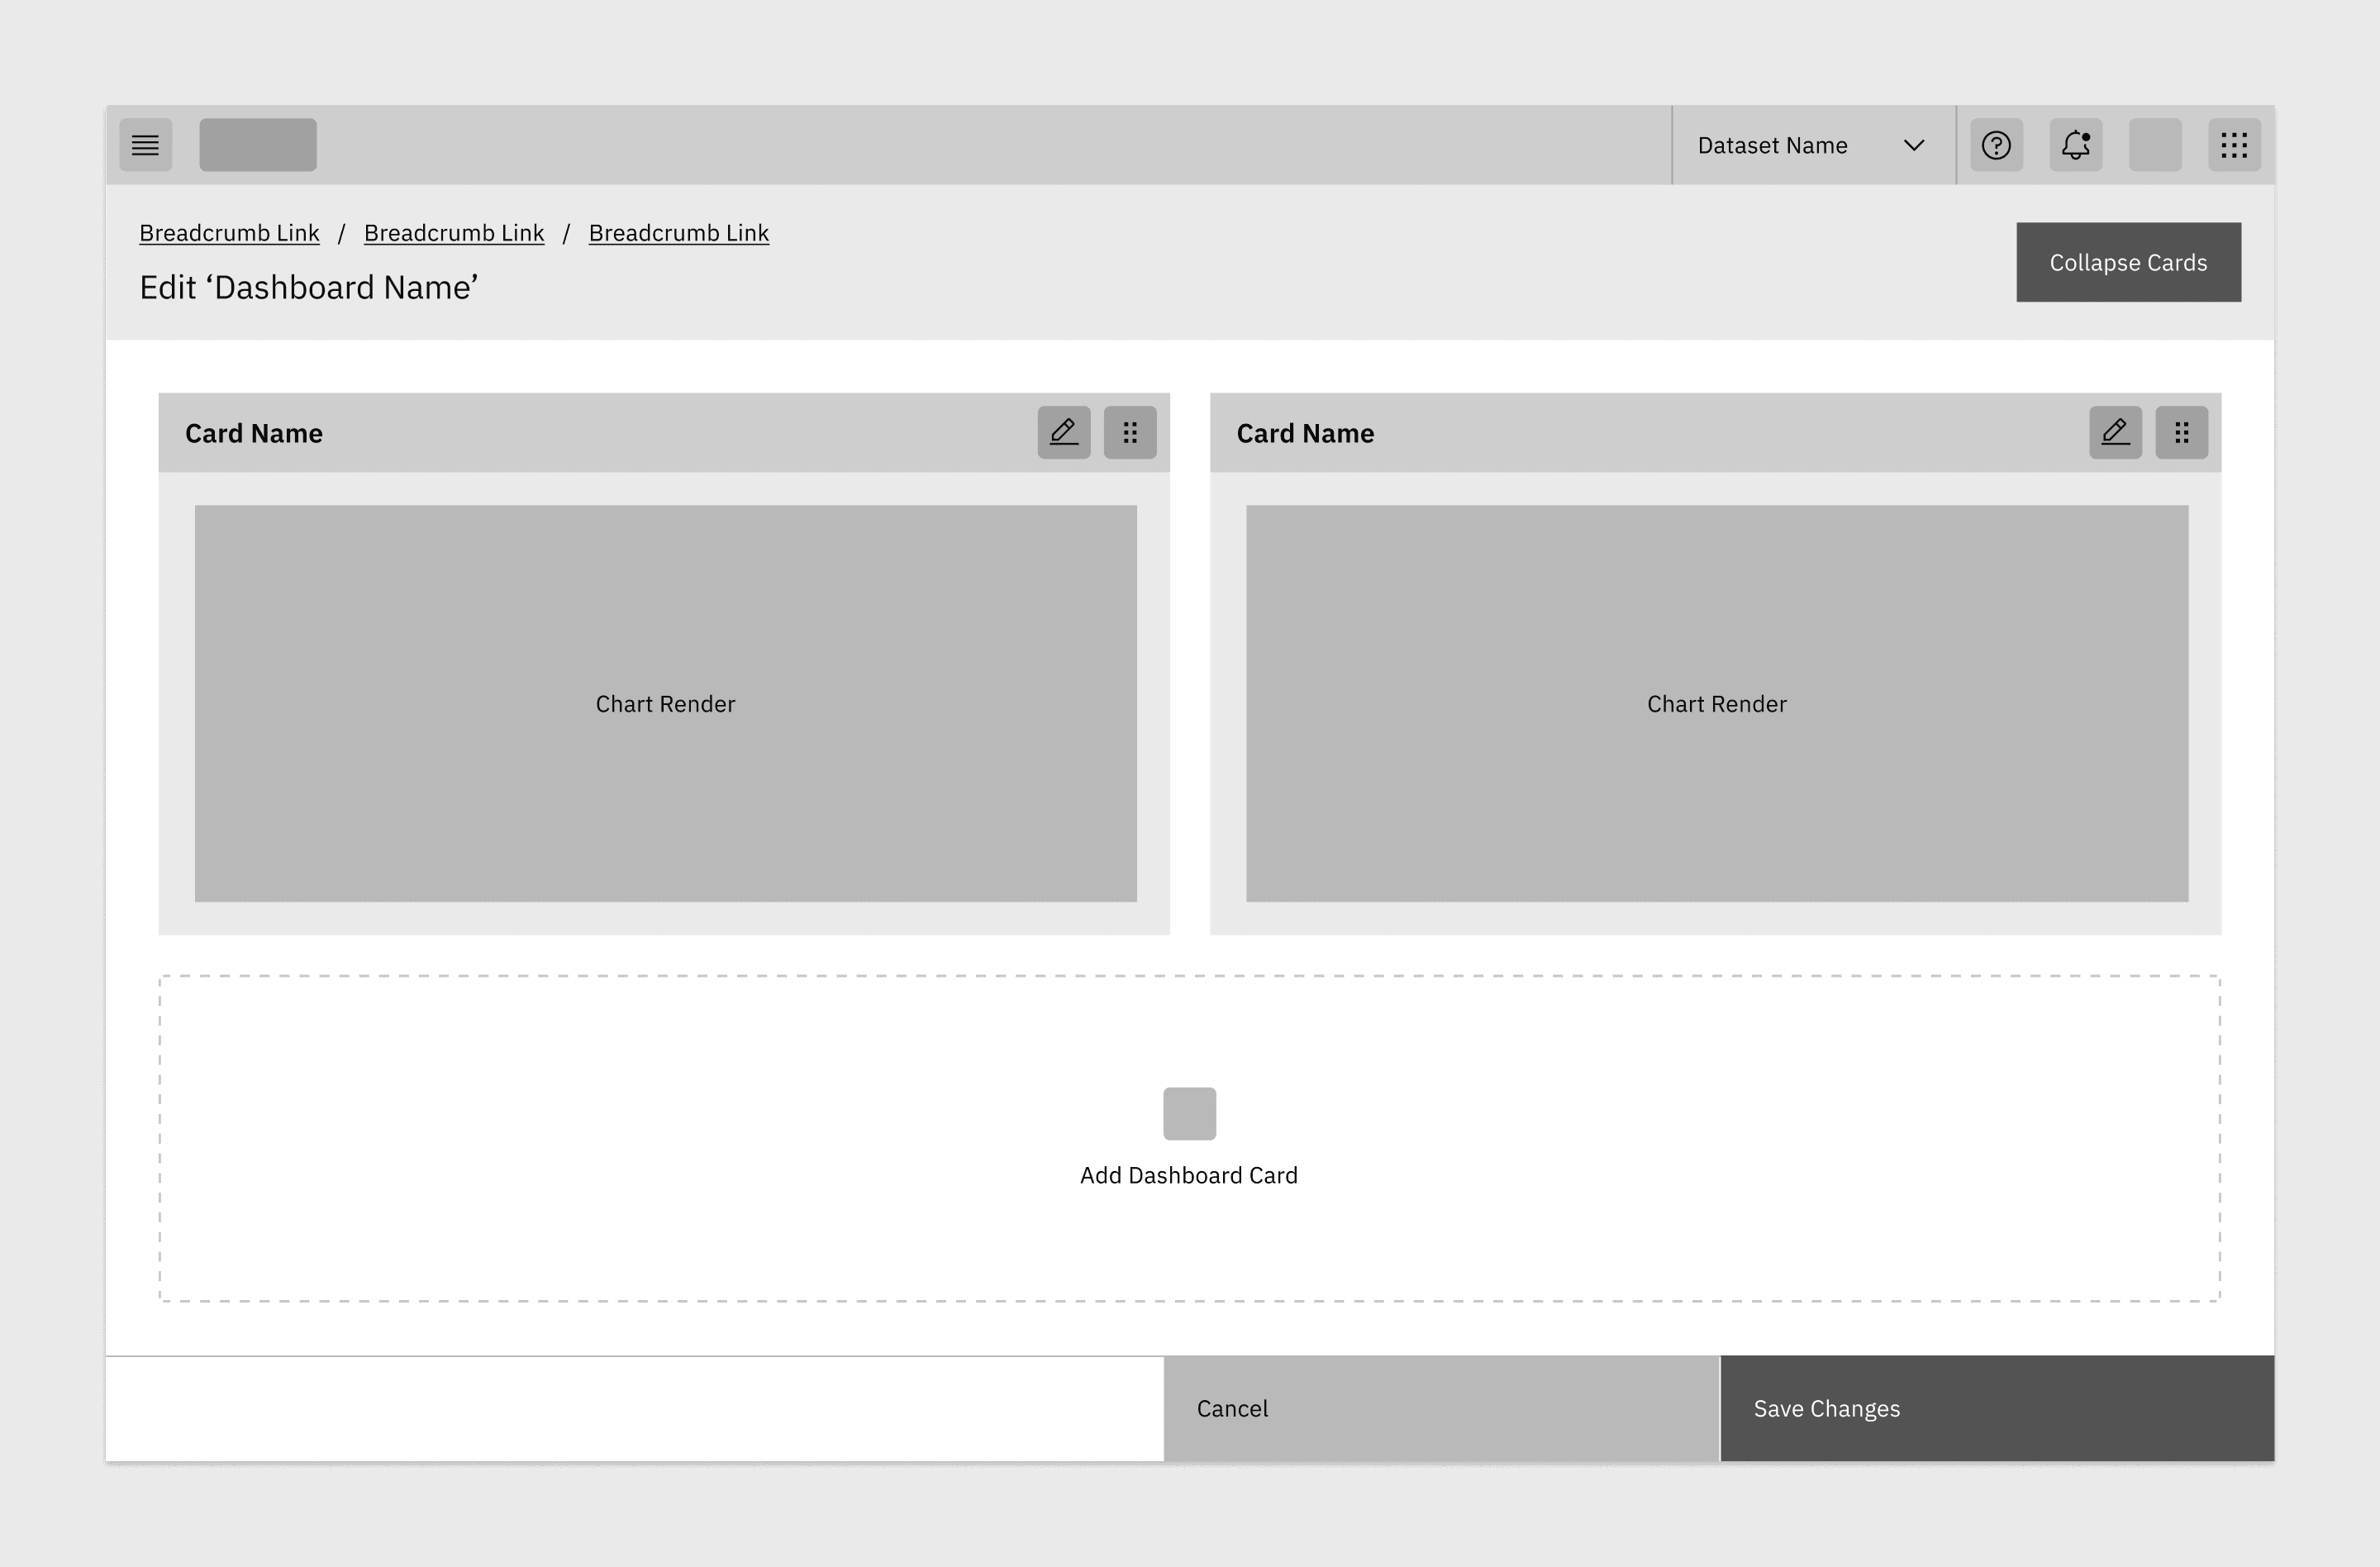
Introduce card resizing and reorganising — Implement drag-and-drop controls that enable users to resize, reorder and reorganise the contents of dashboard pages. Allowing for the side-by-side display of related content.
Grouping customisation options
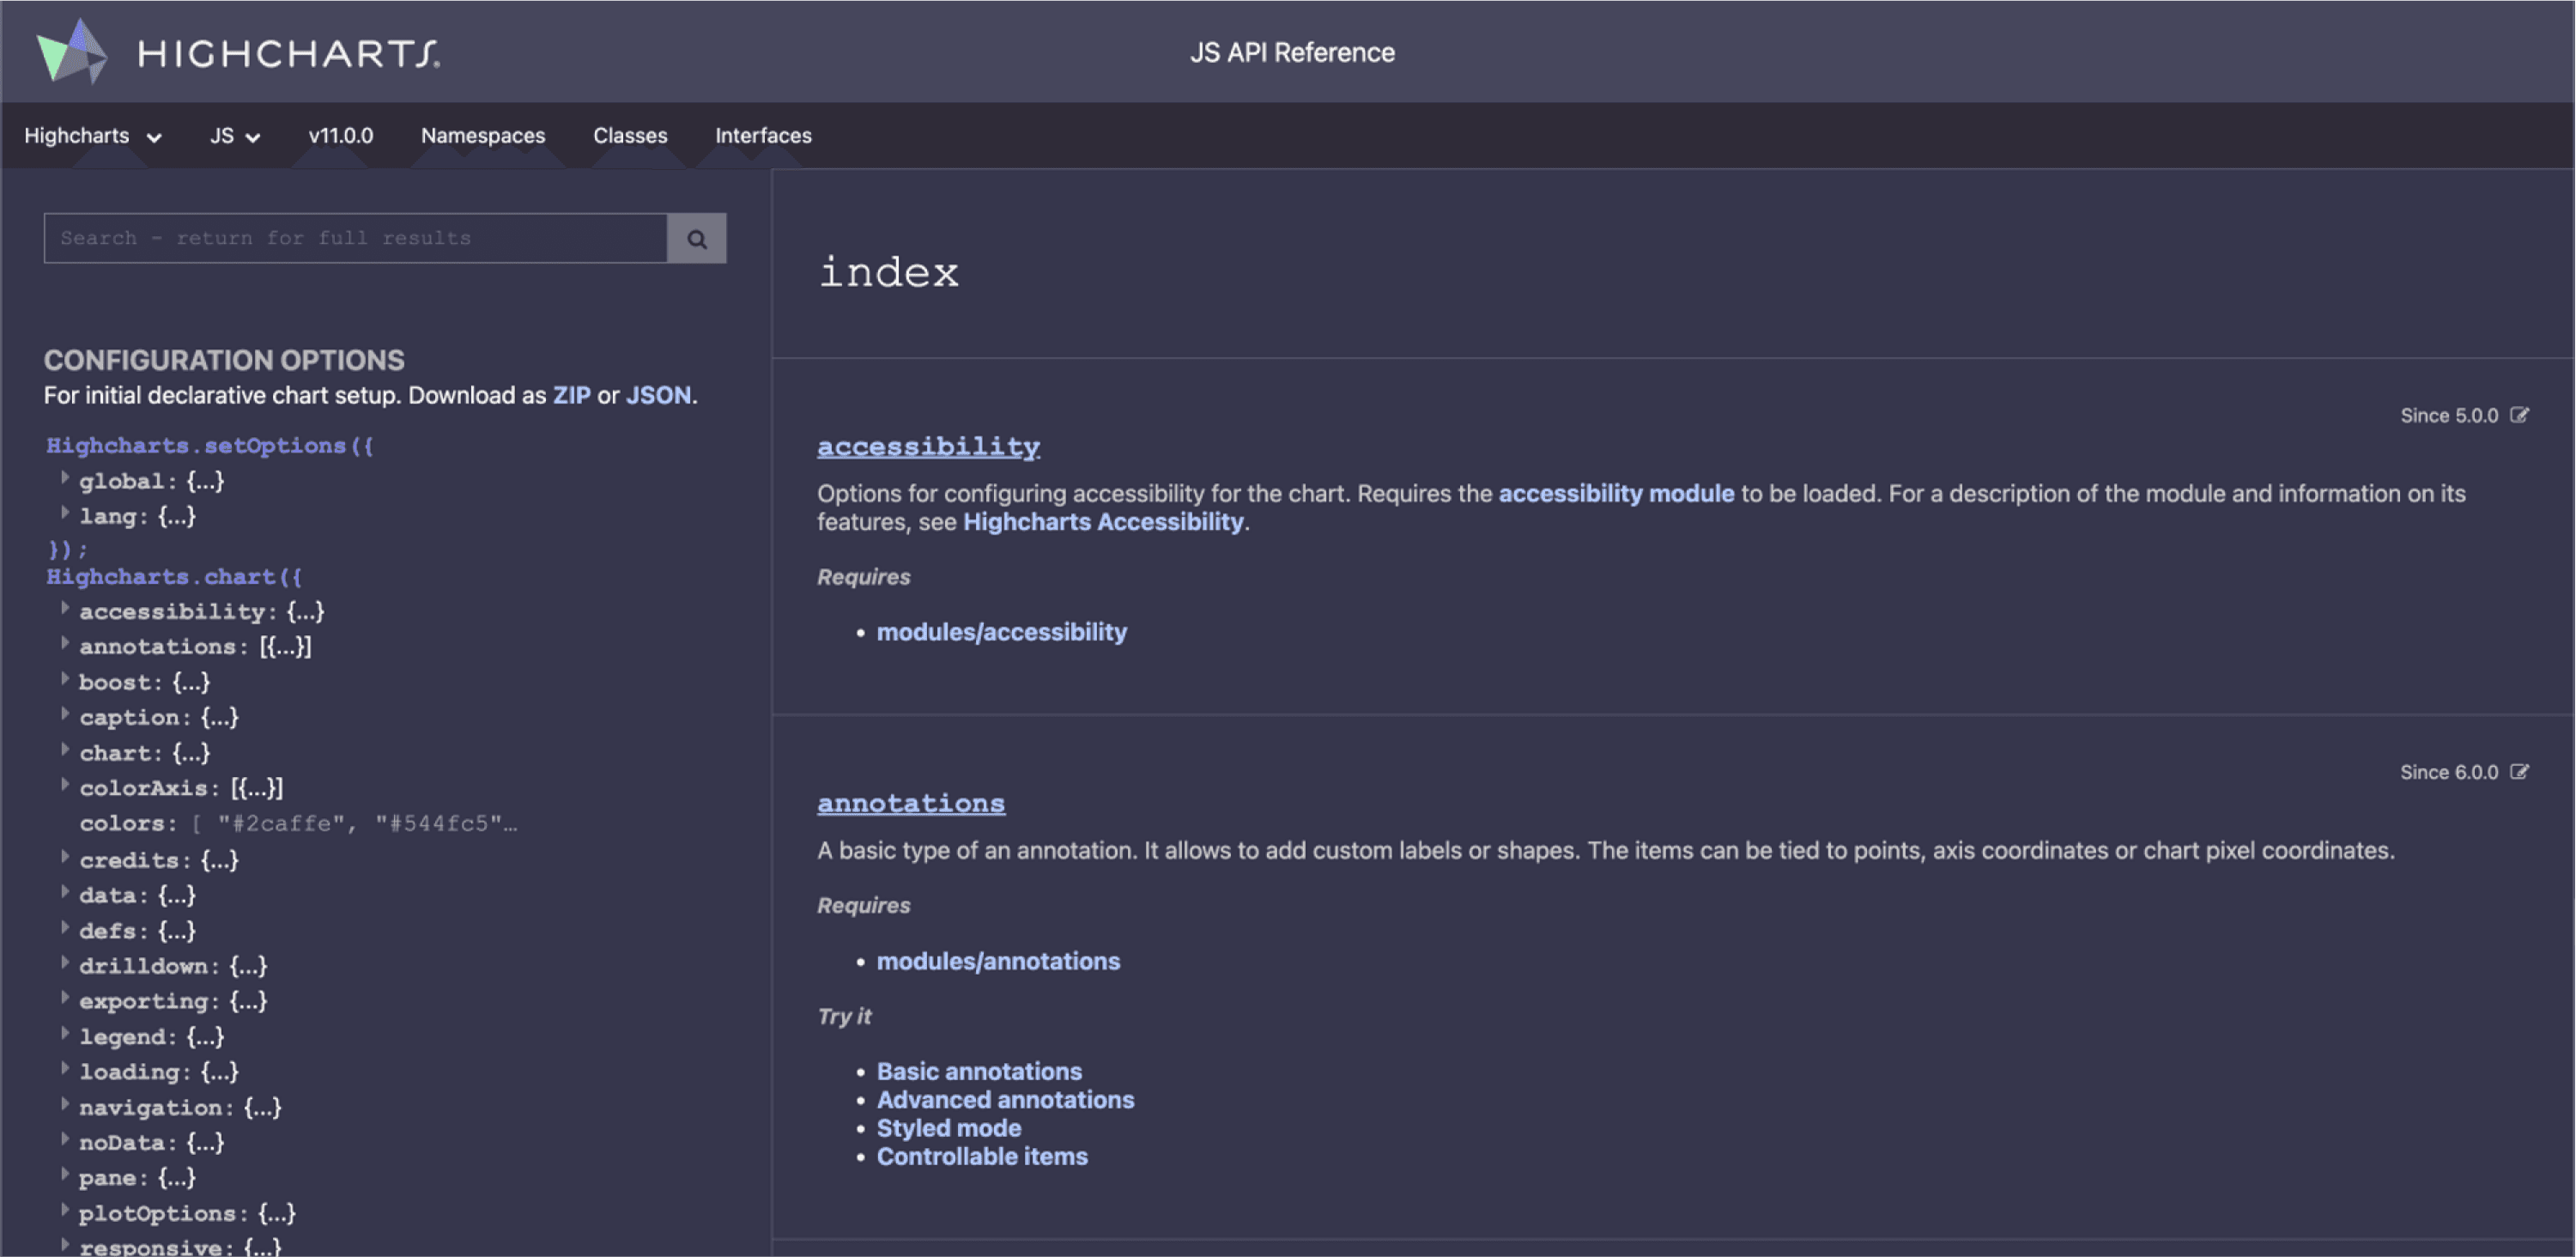
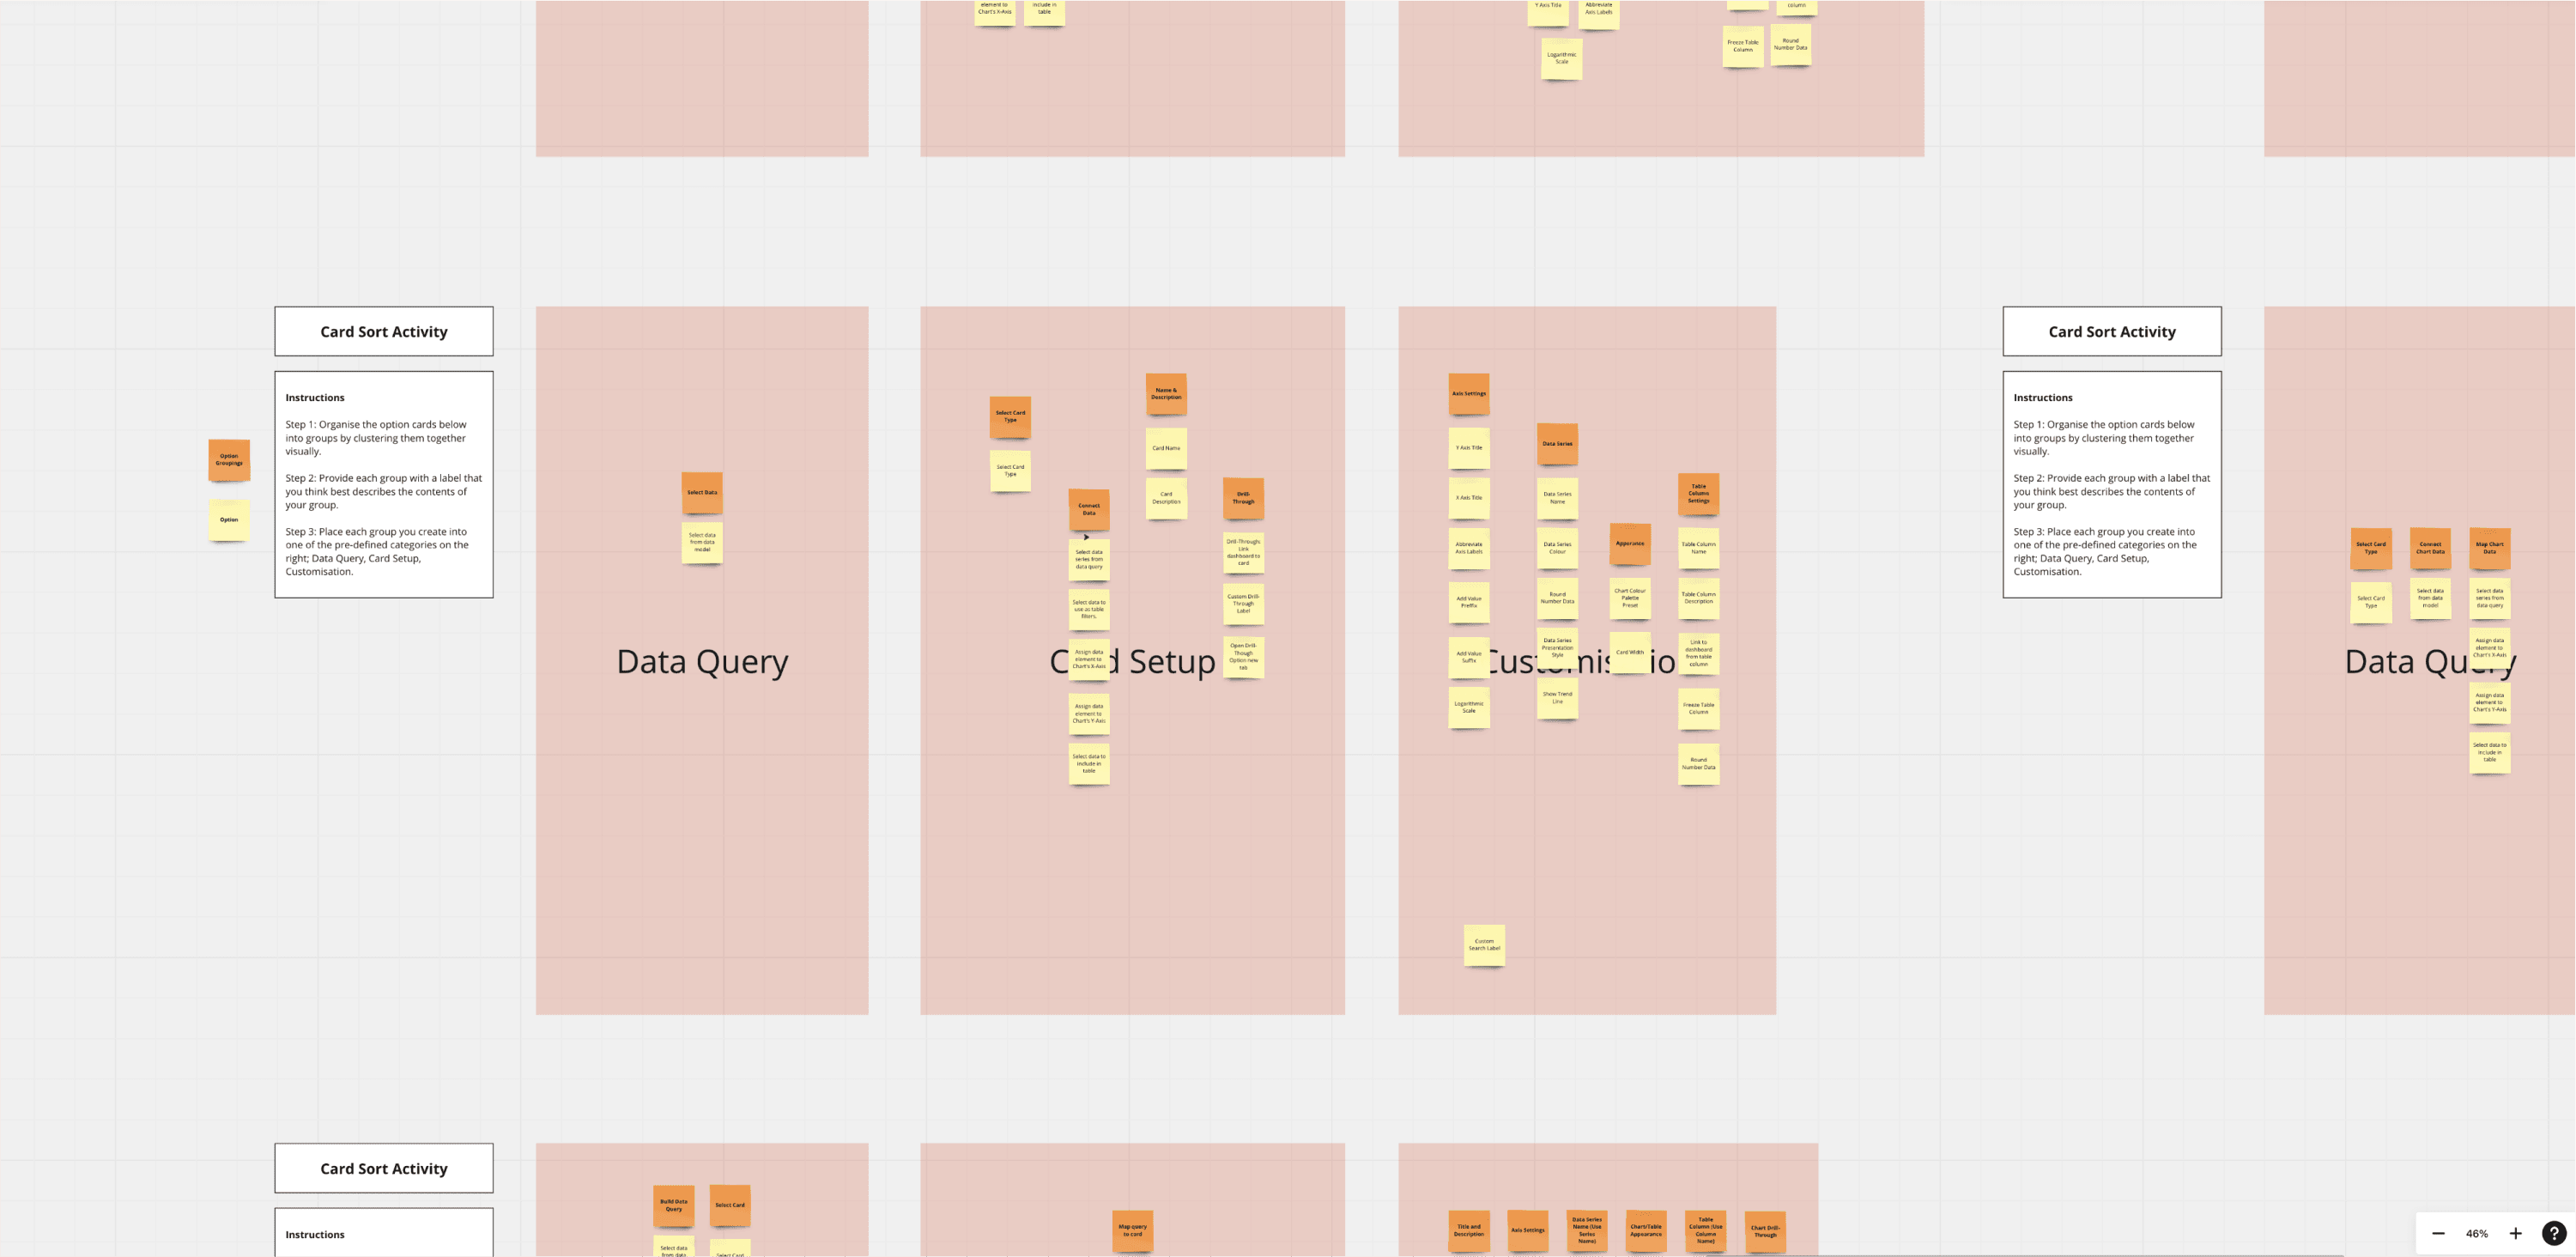
To better understand what visualisation and customisation options we could provide to users, I started investigating the API used to create charts throughout Eamli. In this case, the API used is HighCharts. During this process, I created a list of the different controls supported by the high charts API. I would take this list and run a card-sorting exercise with users to better understand how they would expect to see customisation options grouped and organised. This exercise involved observing how users decided to group different options and what label they chose to give to the groups they had created.
Information Architecture
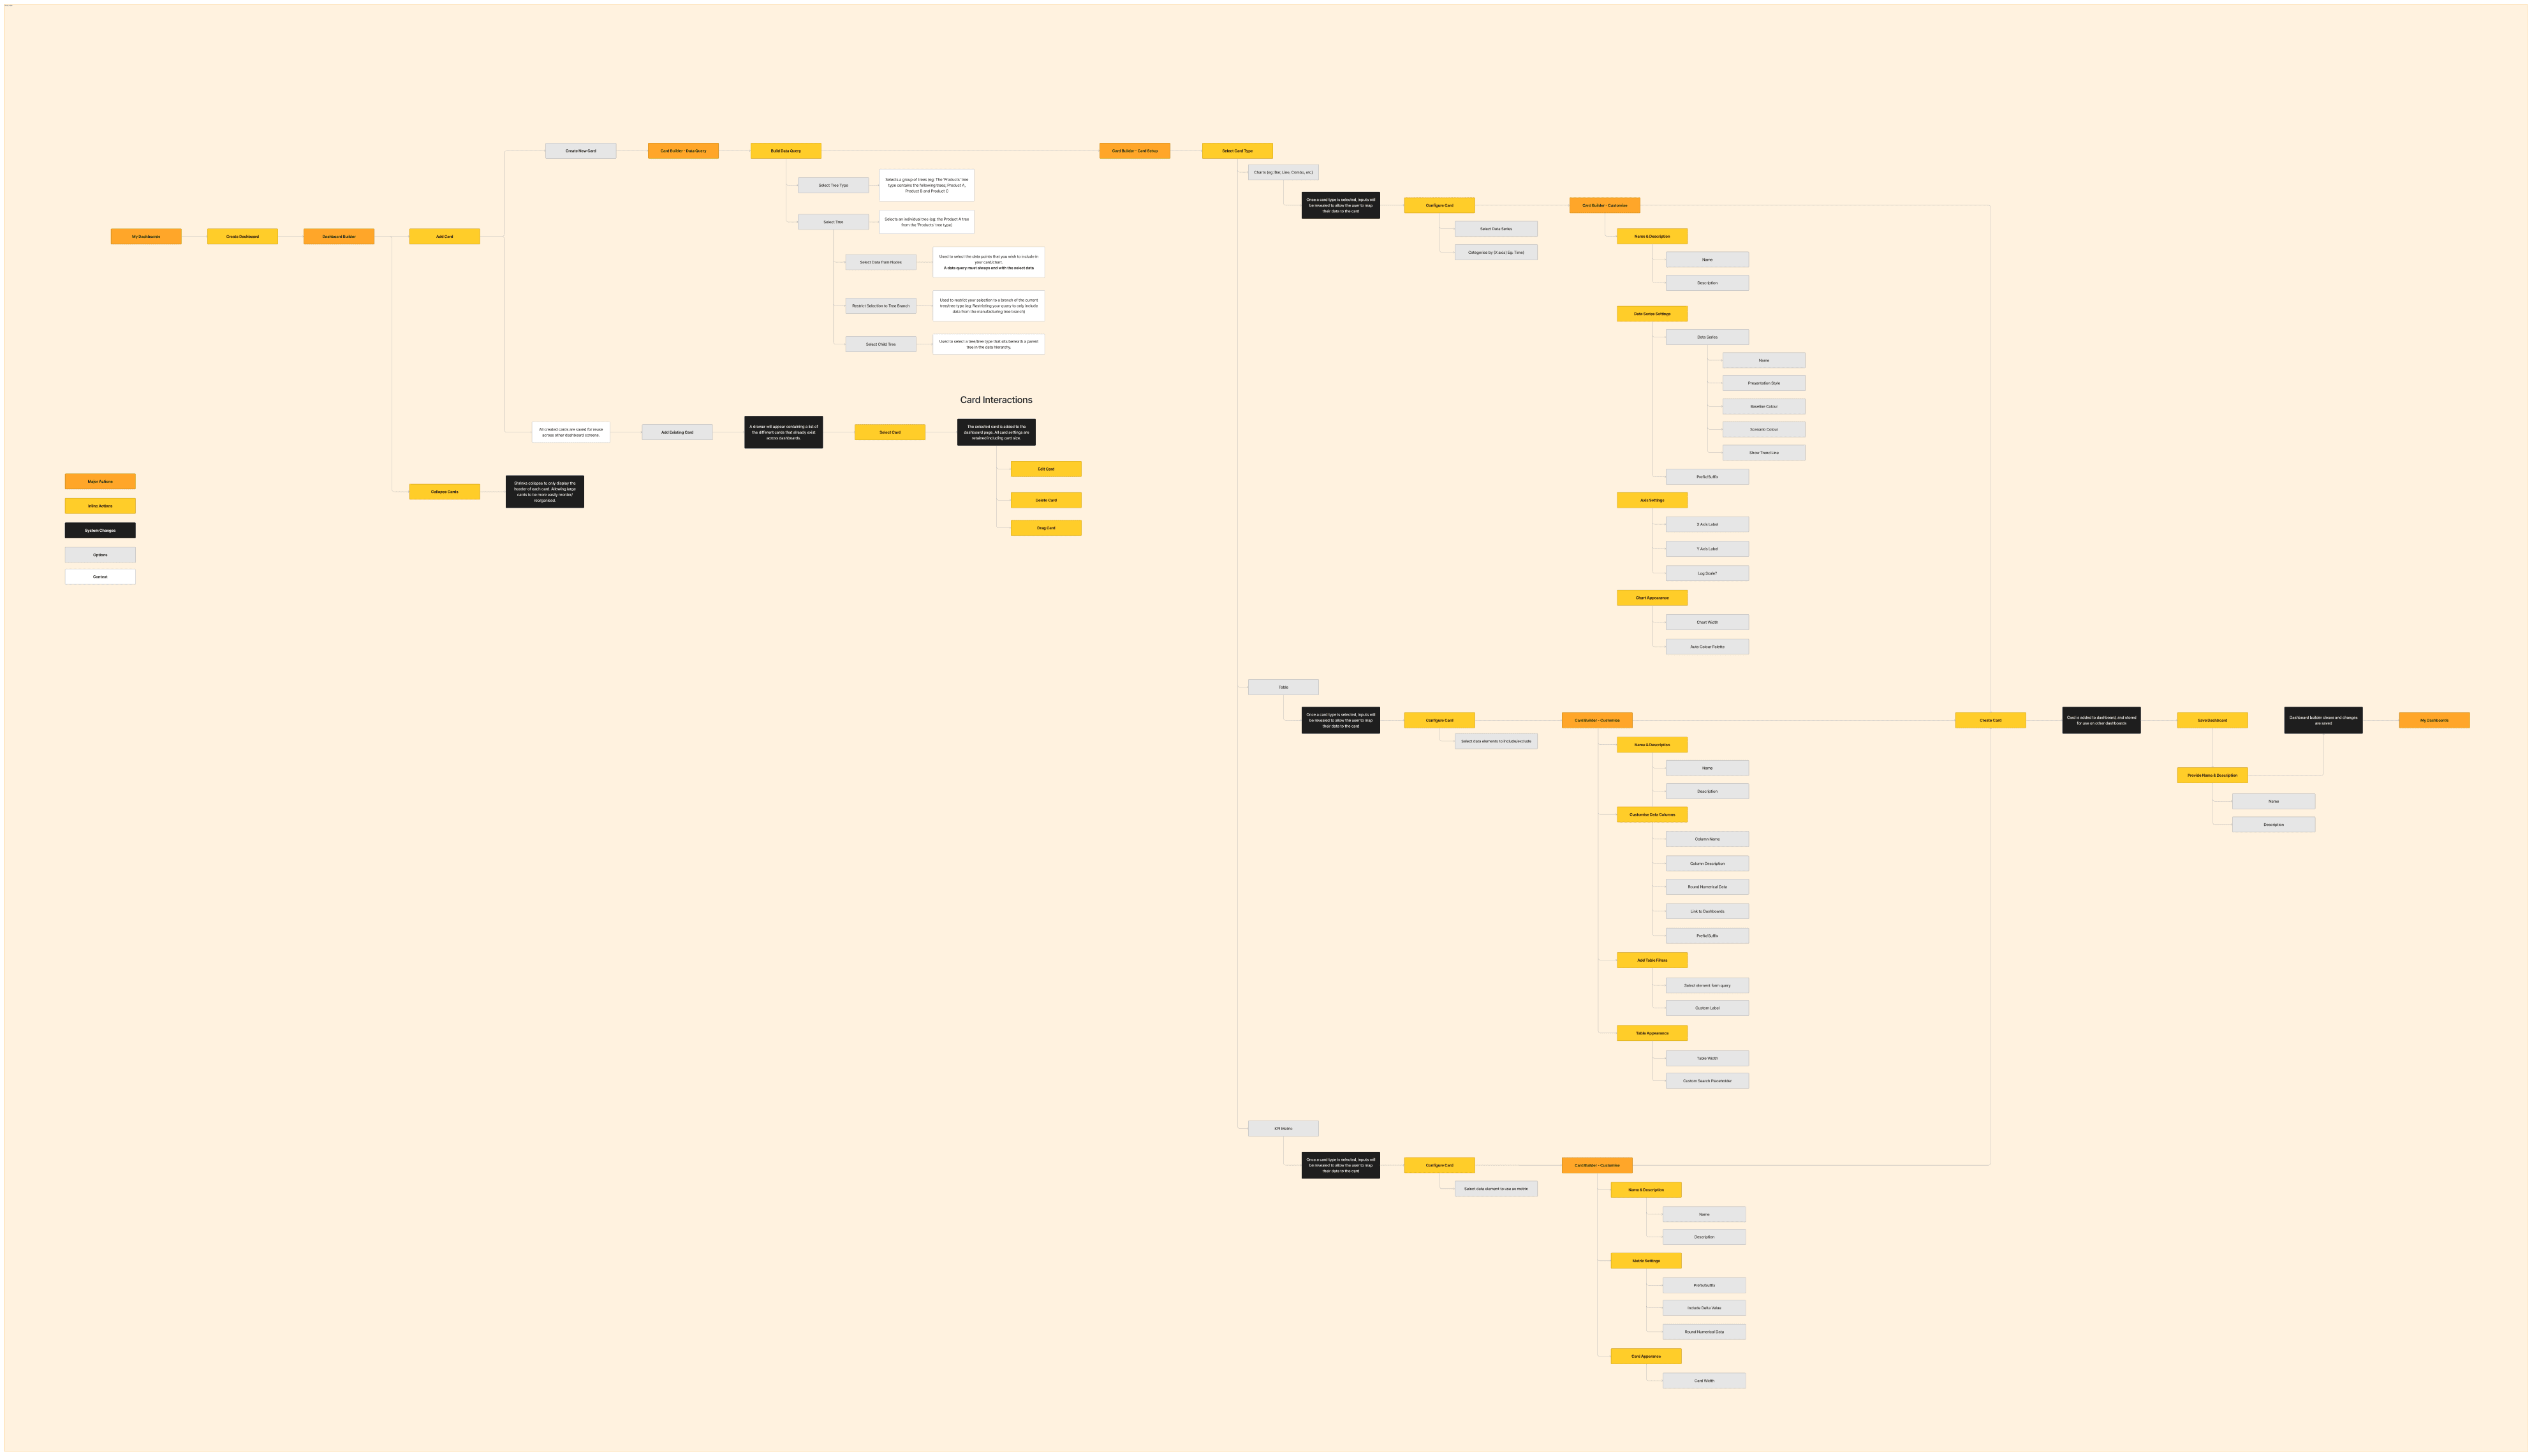
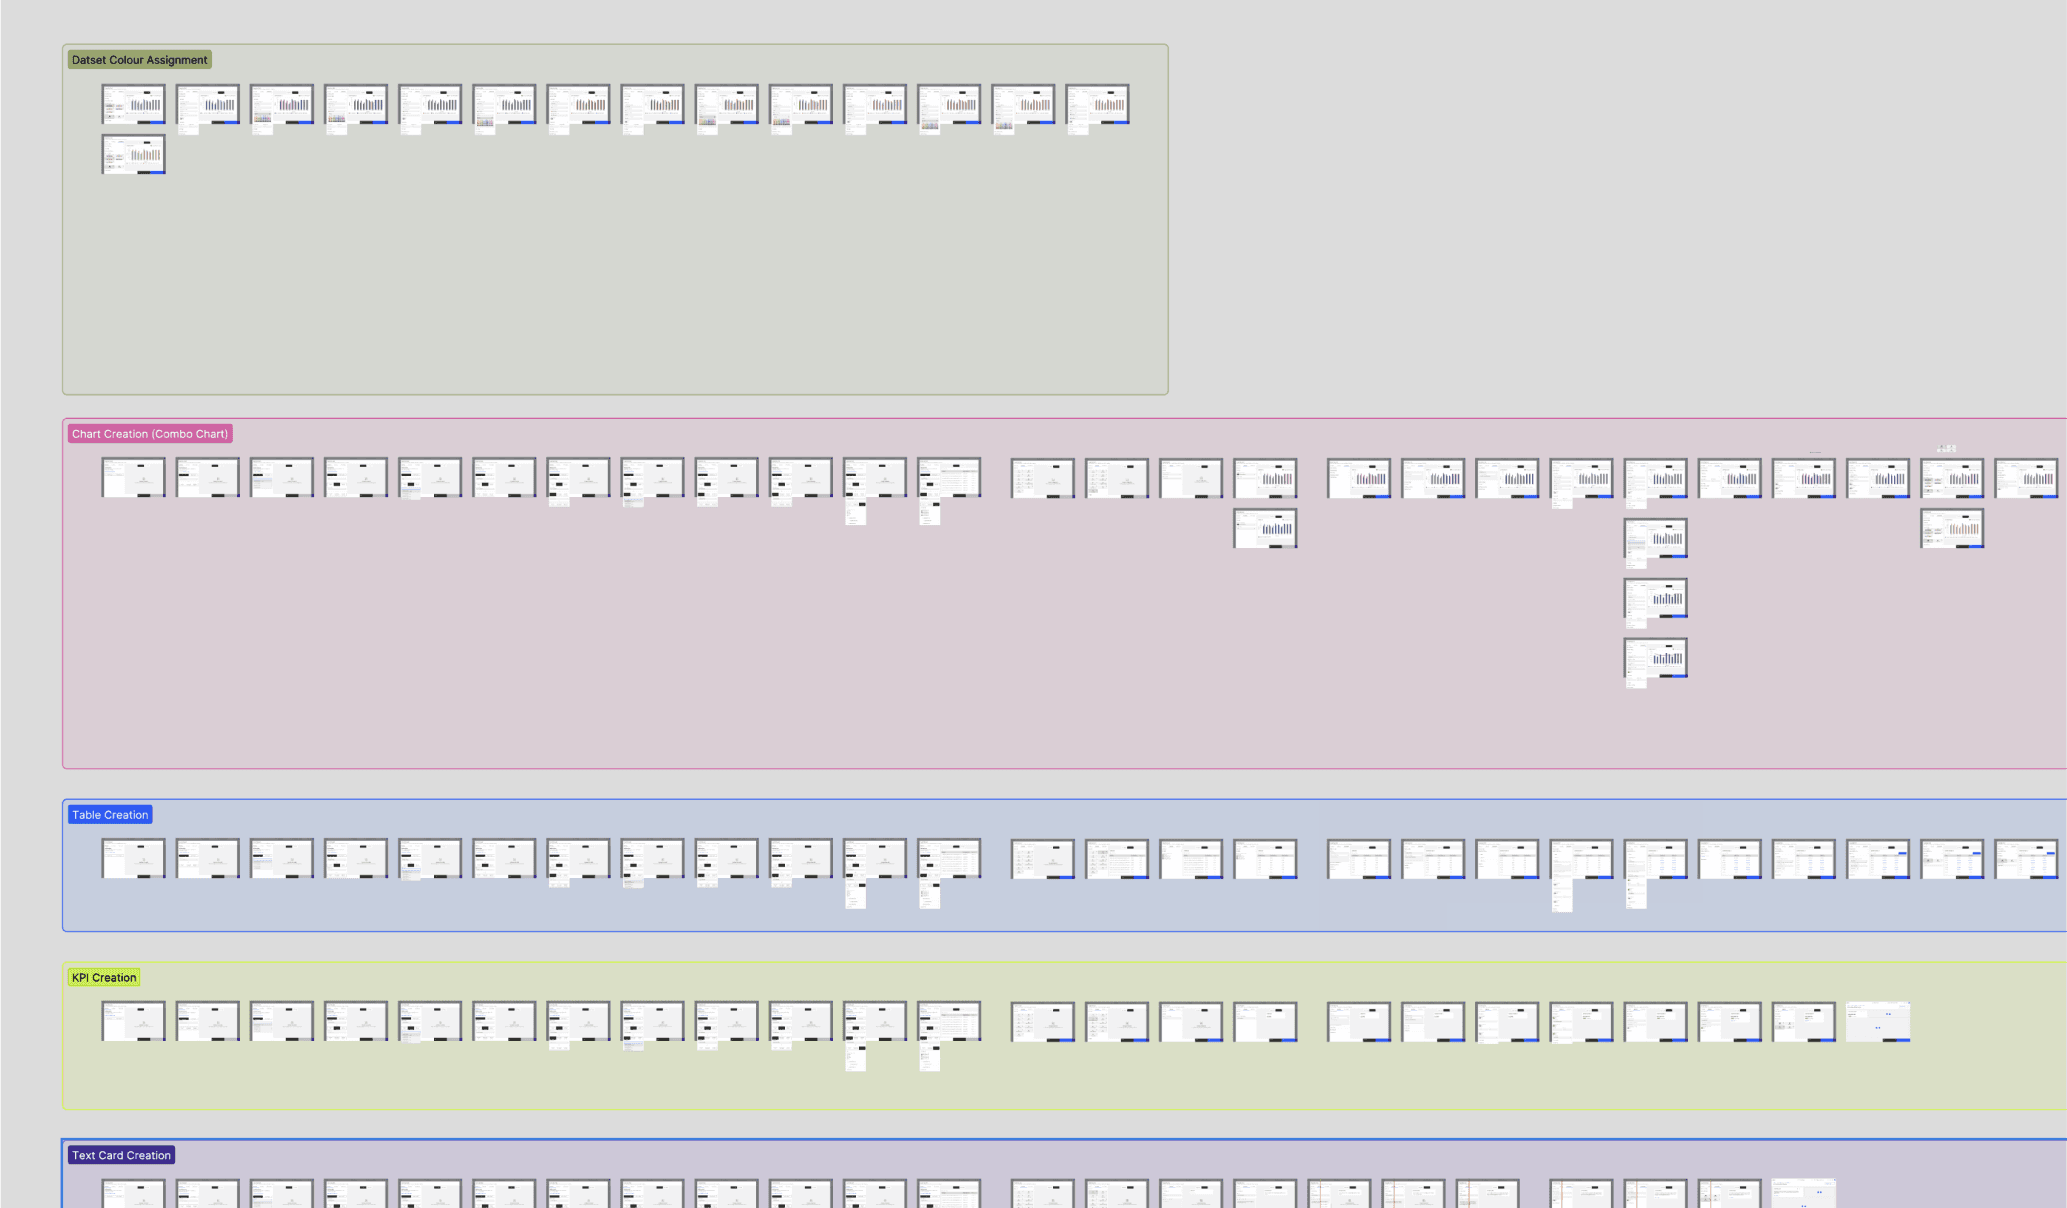
Considering there are many separate processes involved in creating dashboards, I decided that it was essential to create an information architecture map before committing to any design work. Working closely with relevant stakeholders, I mapped out the different steps involved in creating dashboards and dashboard cards. The result was a process map that allowed all stakeholders to align on a clear and intuitive process that users could follow when creating dashboards.
Design Process
Following the discovery and exploration phase, I designed initial concepts for the dashboard builder flow using sketches and wireframes. To ensure that we did not dedicate too much time to any single idea, I tested my initial concepts with data modellers over video calls before committing to higher-fidelity designs.
After all stakeholders had approved of an initial idea, I moved on to creating a high-fidelity flow that covered dashboard and card creation in much greater detail. Once complete, this flow would be reviewed and signed off by key stakeholders before being handed off to the engineering team. From this point, my team and I continued to support development by providing QA testing that ensured the flow functioned as detailed in designs.
Final Design
Dashboard Creation & Customisation
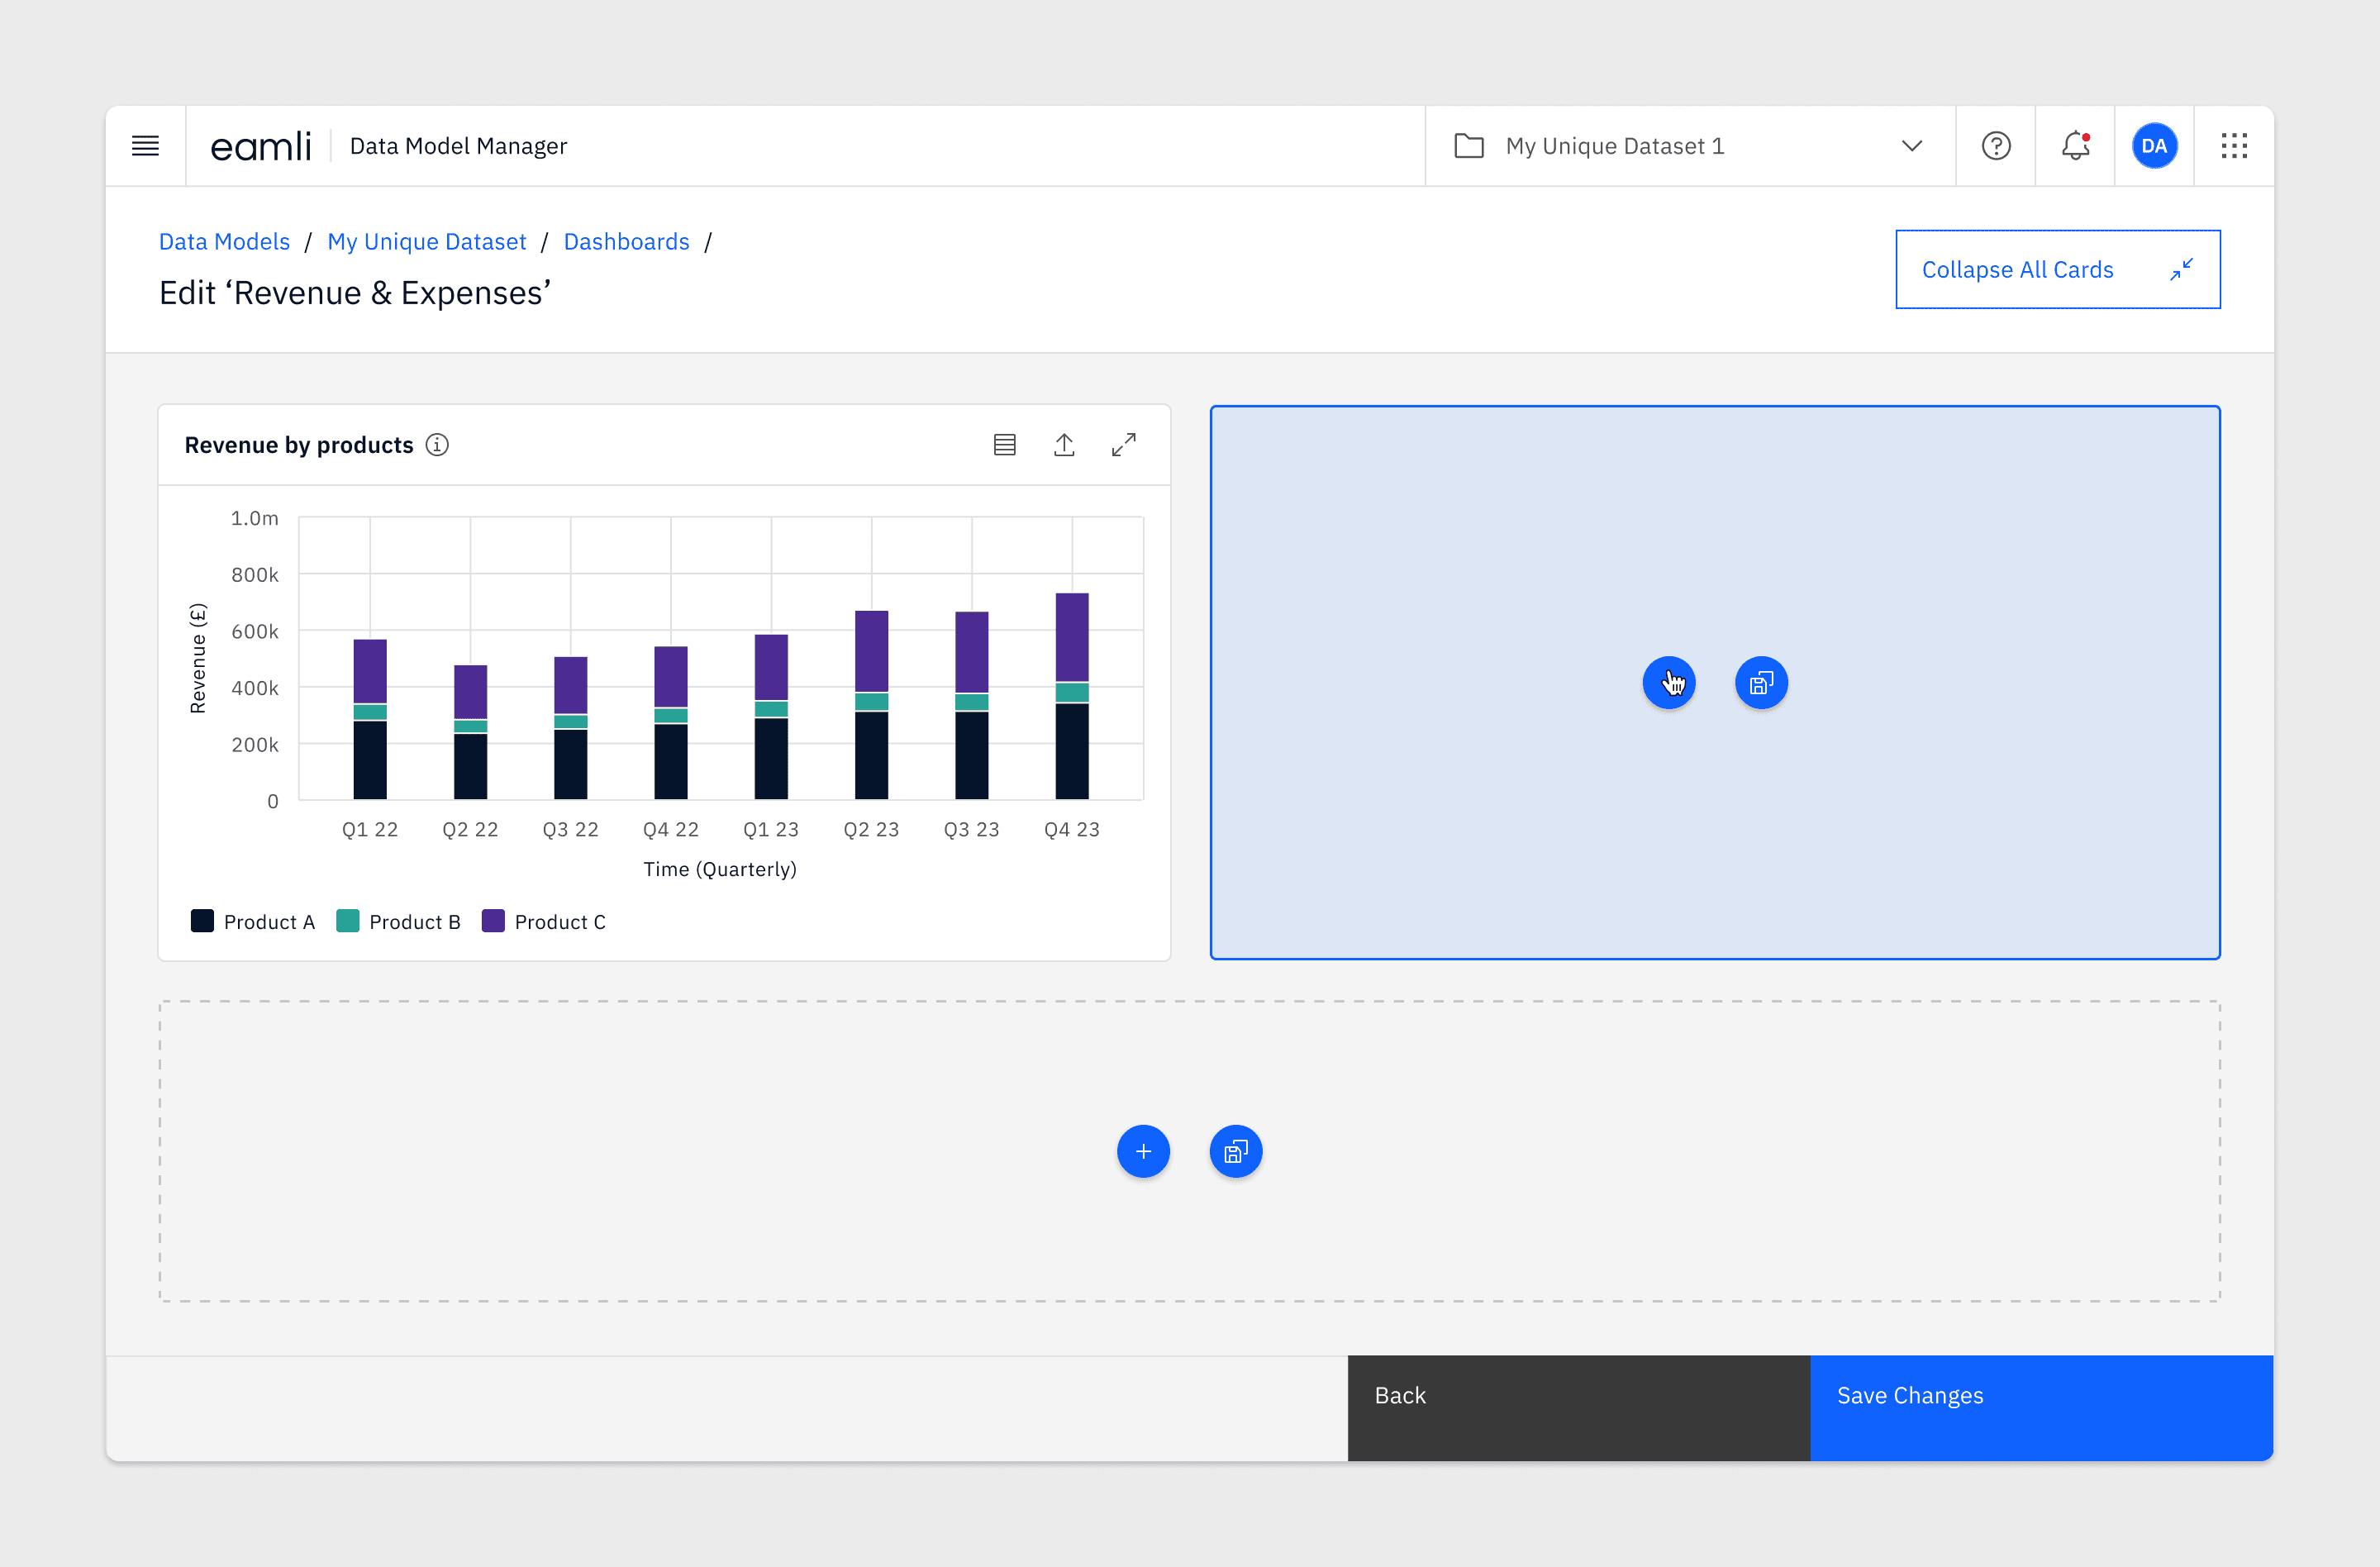
Users can now make more informed decisions through the creation of dashboards that capture the performance of their organisation. The dashboard builder is packed with different options that allow users to visualise their data through the use of KPI metrics, charts, tables and more. Plus, the newly introduced drag-and-drop features make it easy for users to quickly resize and reorganise dashboard content however they need.
Querying your data
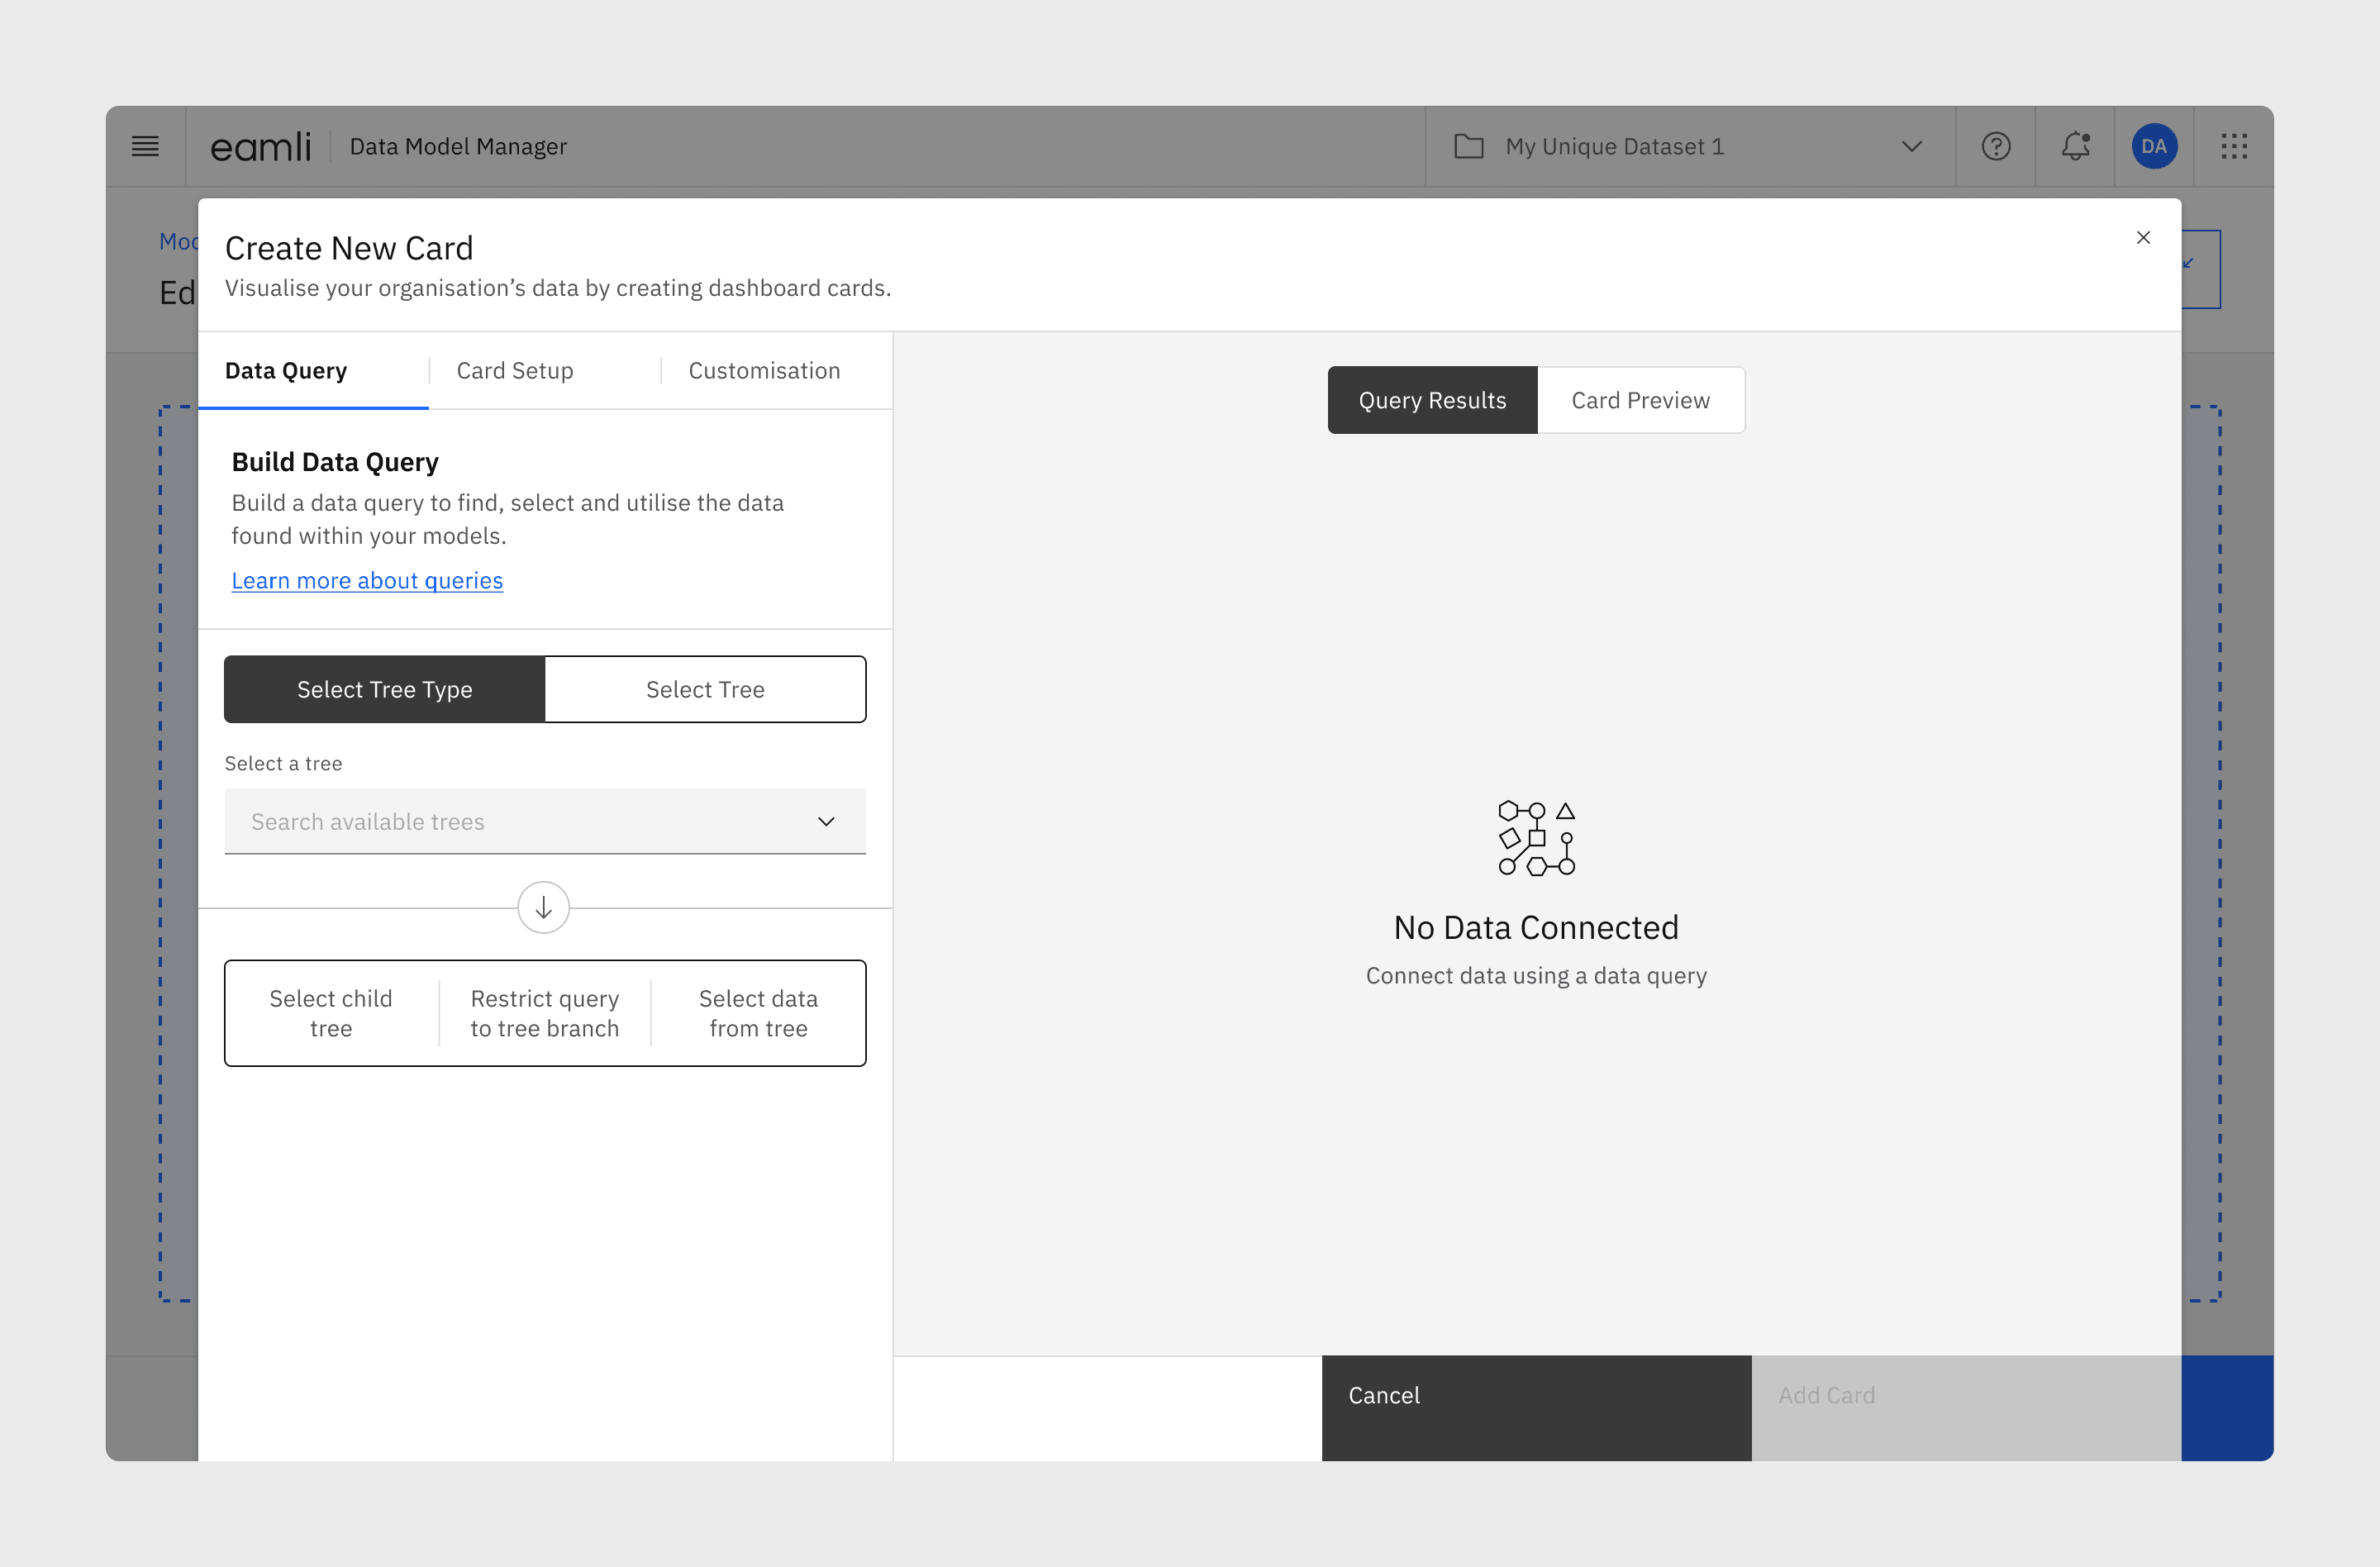
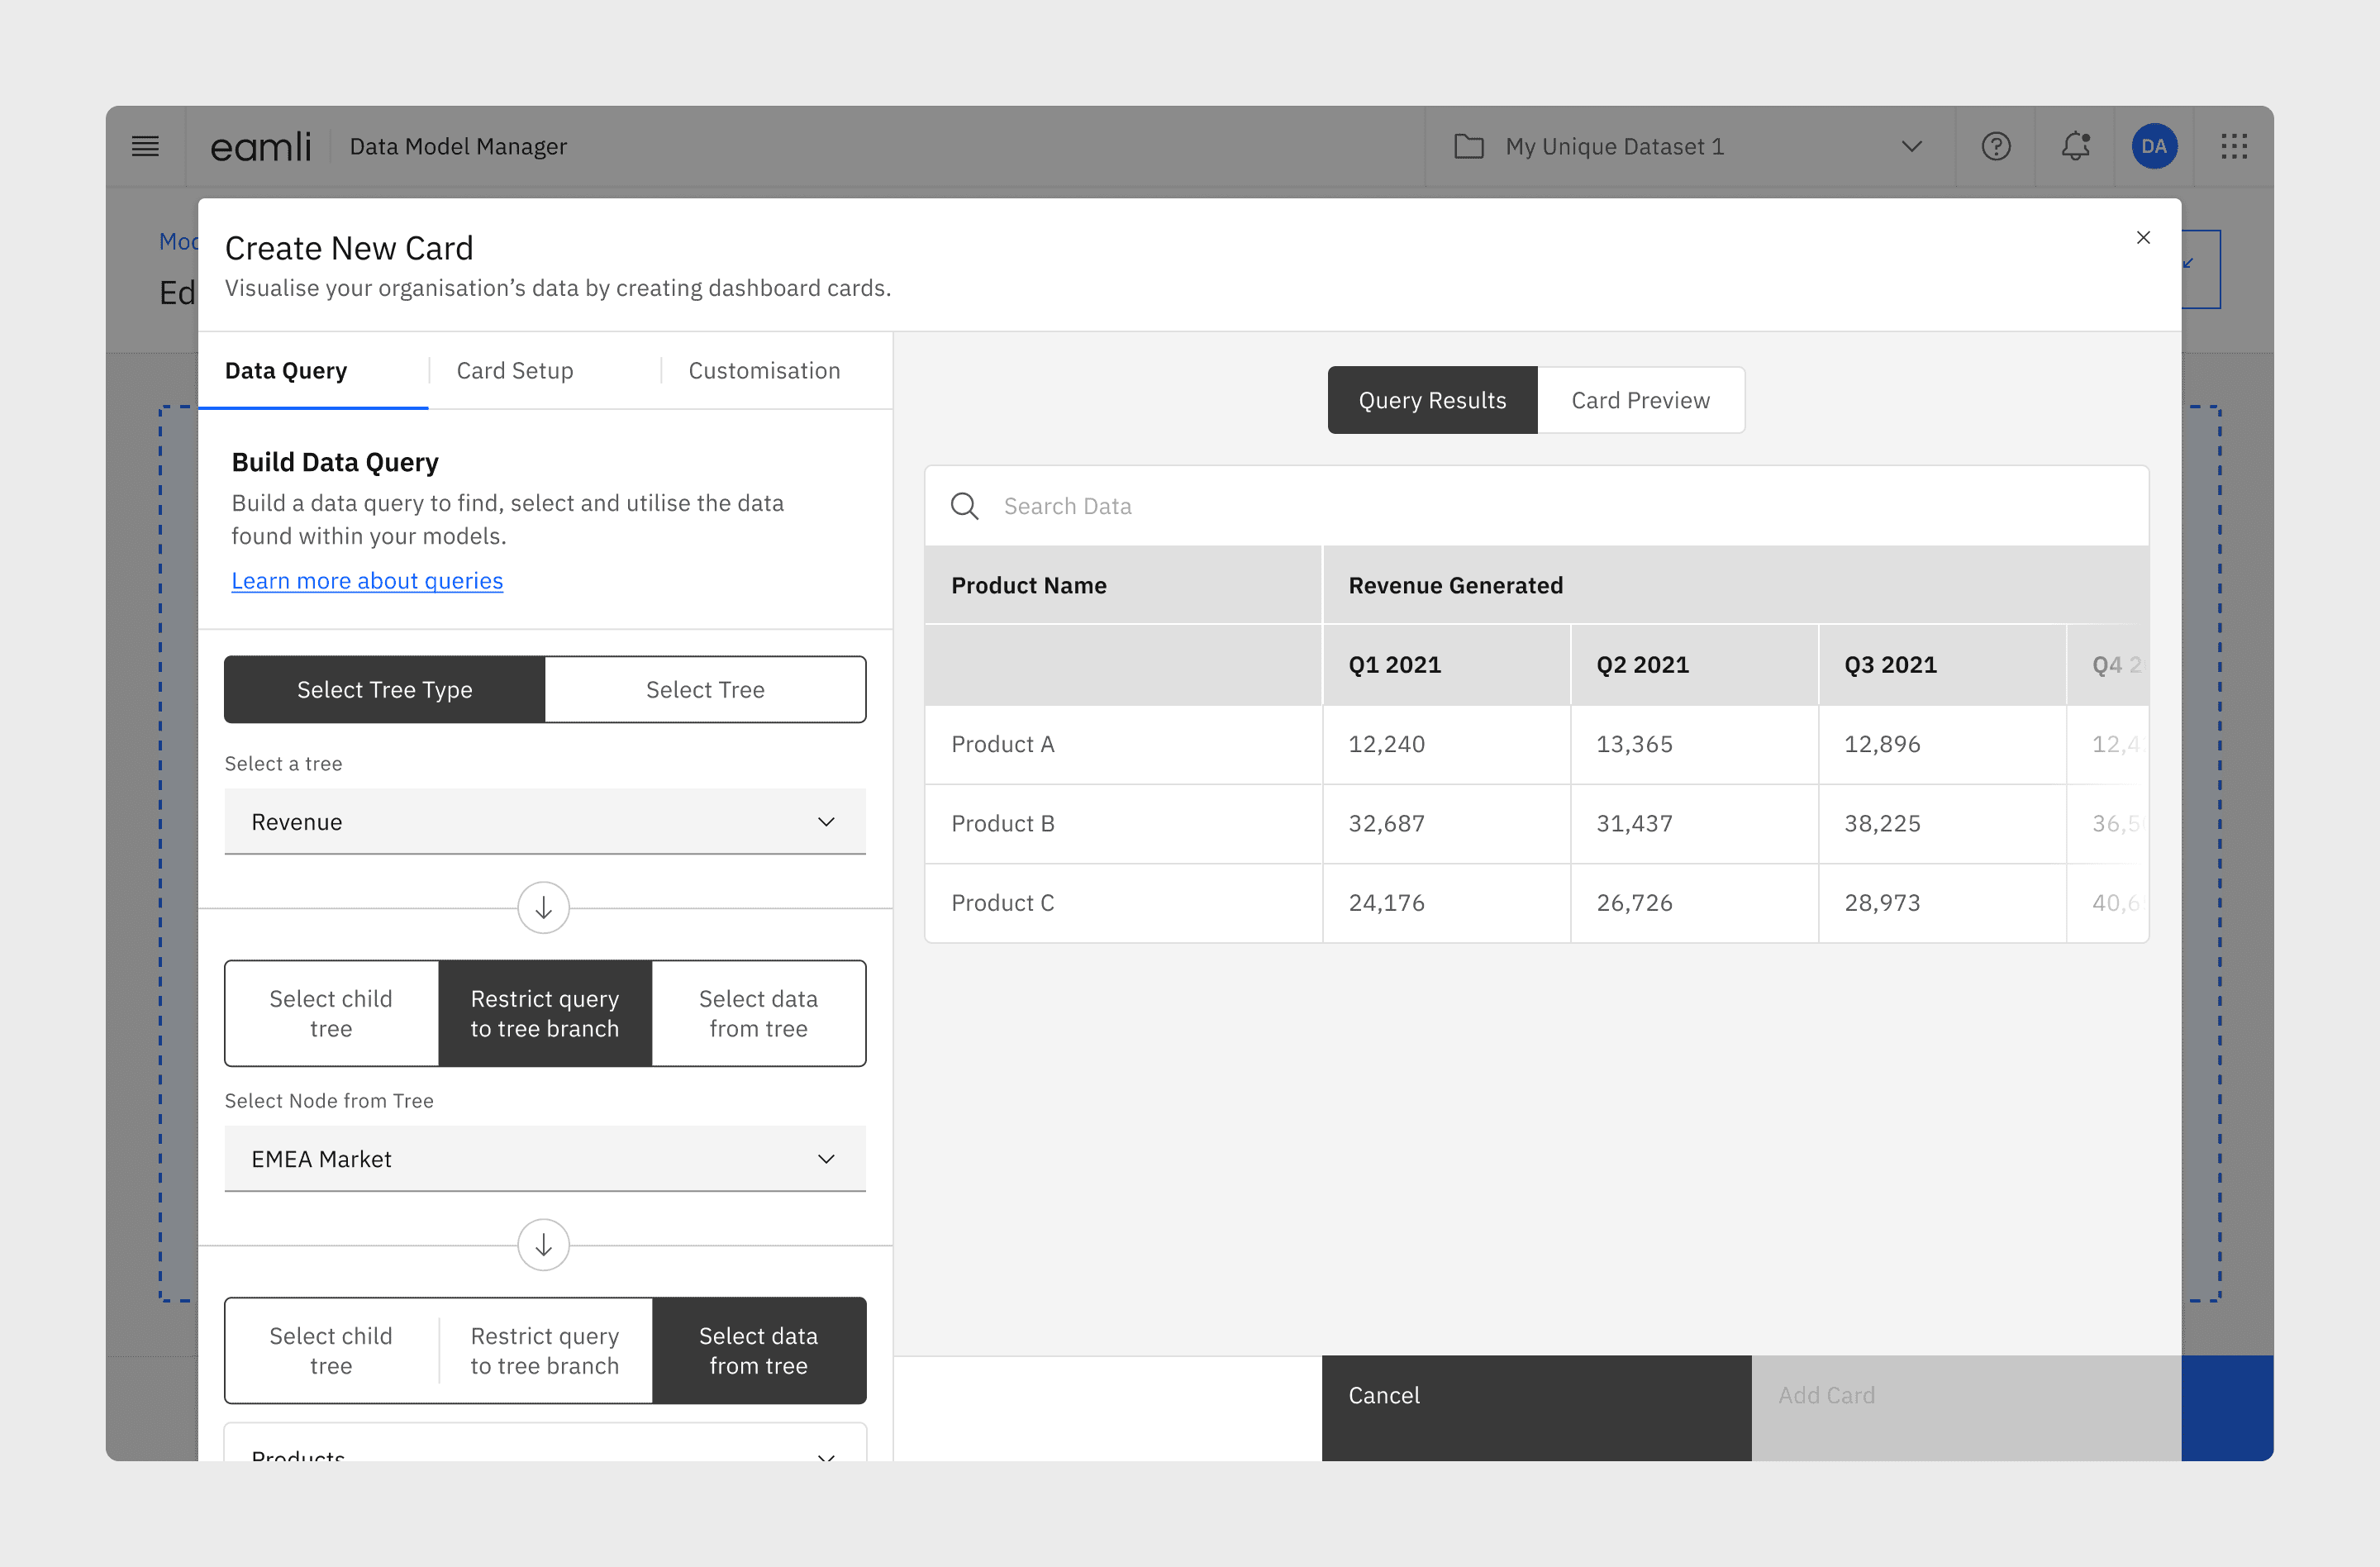
The creation of every dashboard card starts with the same first step; creating a data query which will be used to select content from your data model. Eamli data models are organised into hierarchical data trees, our query builder helps users navigate through this tree layer-by-layer to find and select their desired data. Throughout this process, users can restrict their selection to create a segmented view of their data, allowing charts to visualise information from any perspective.
Card Type Selection & Setup
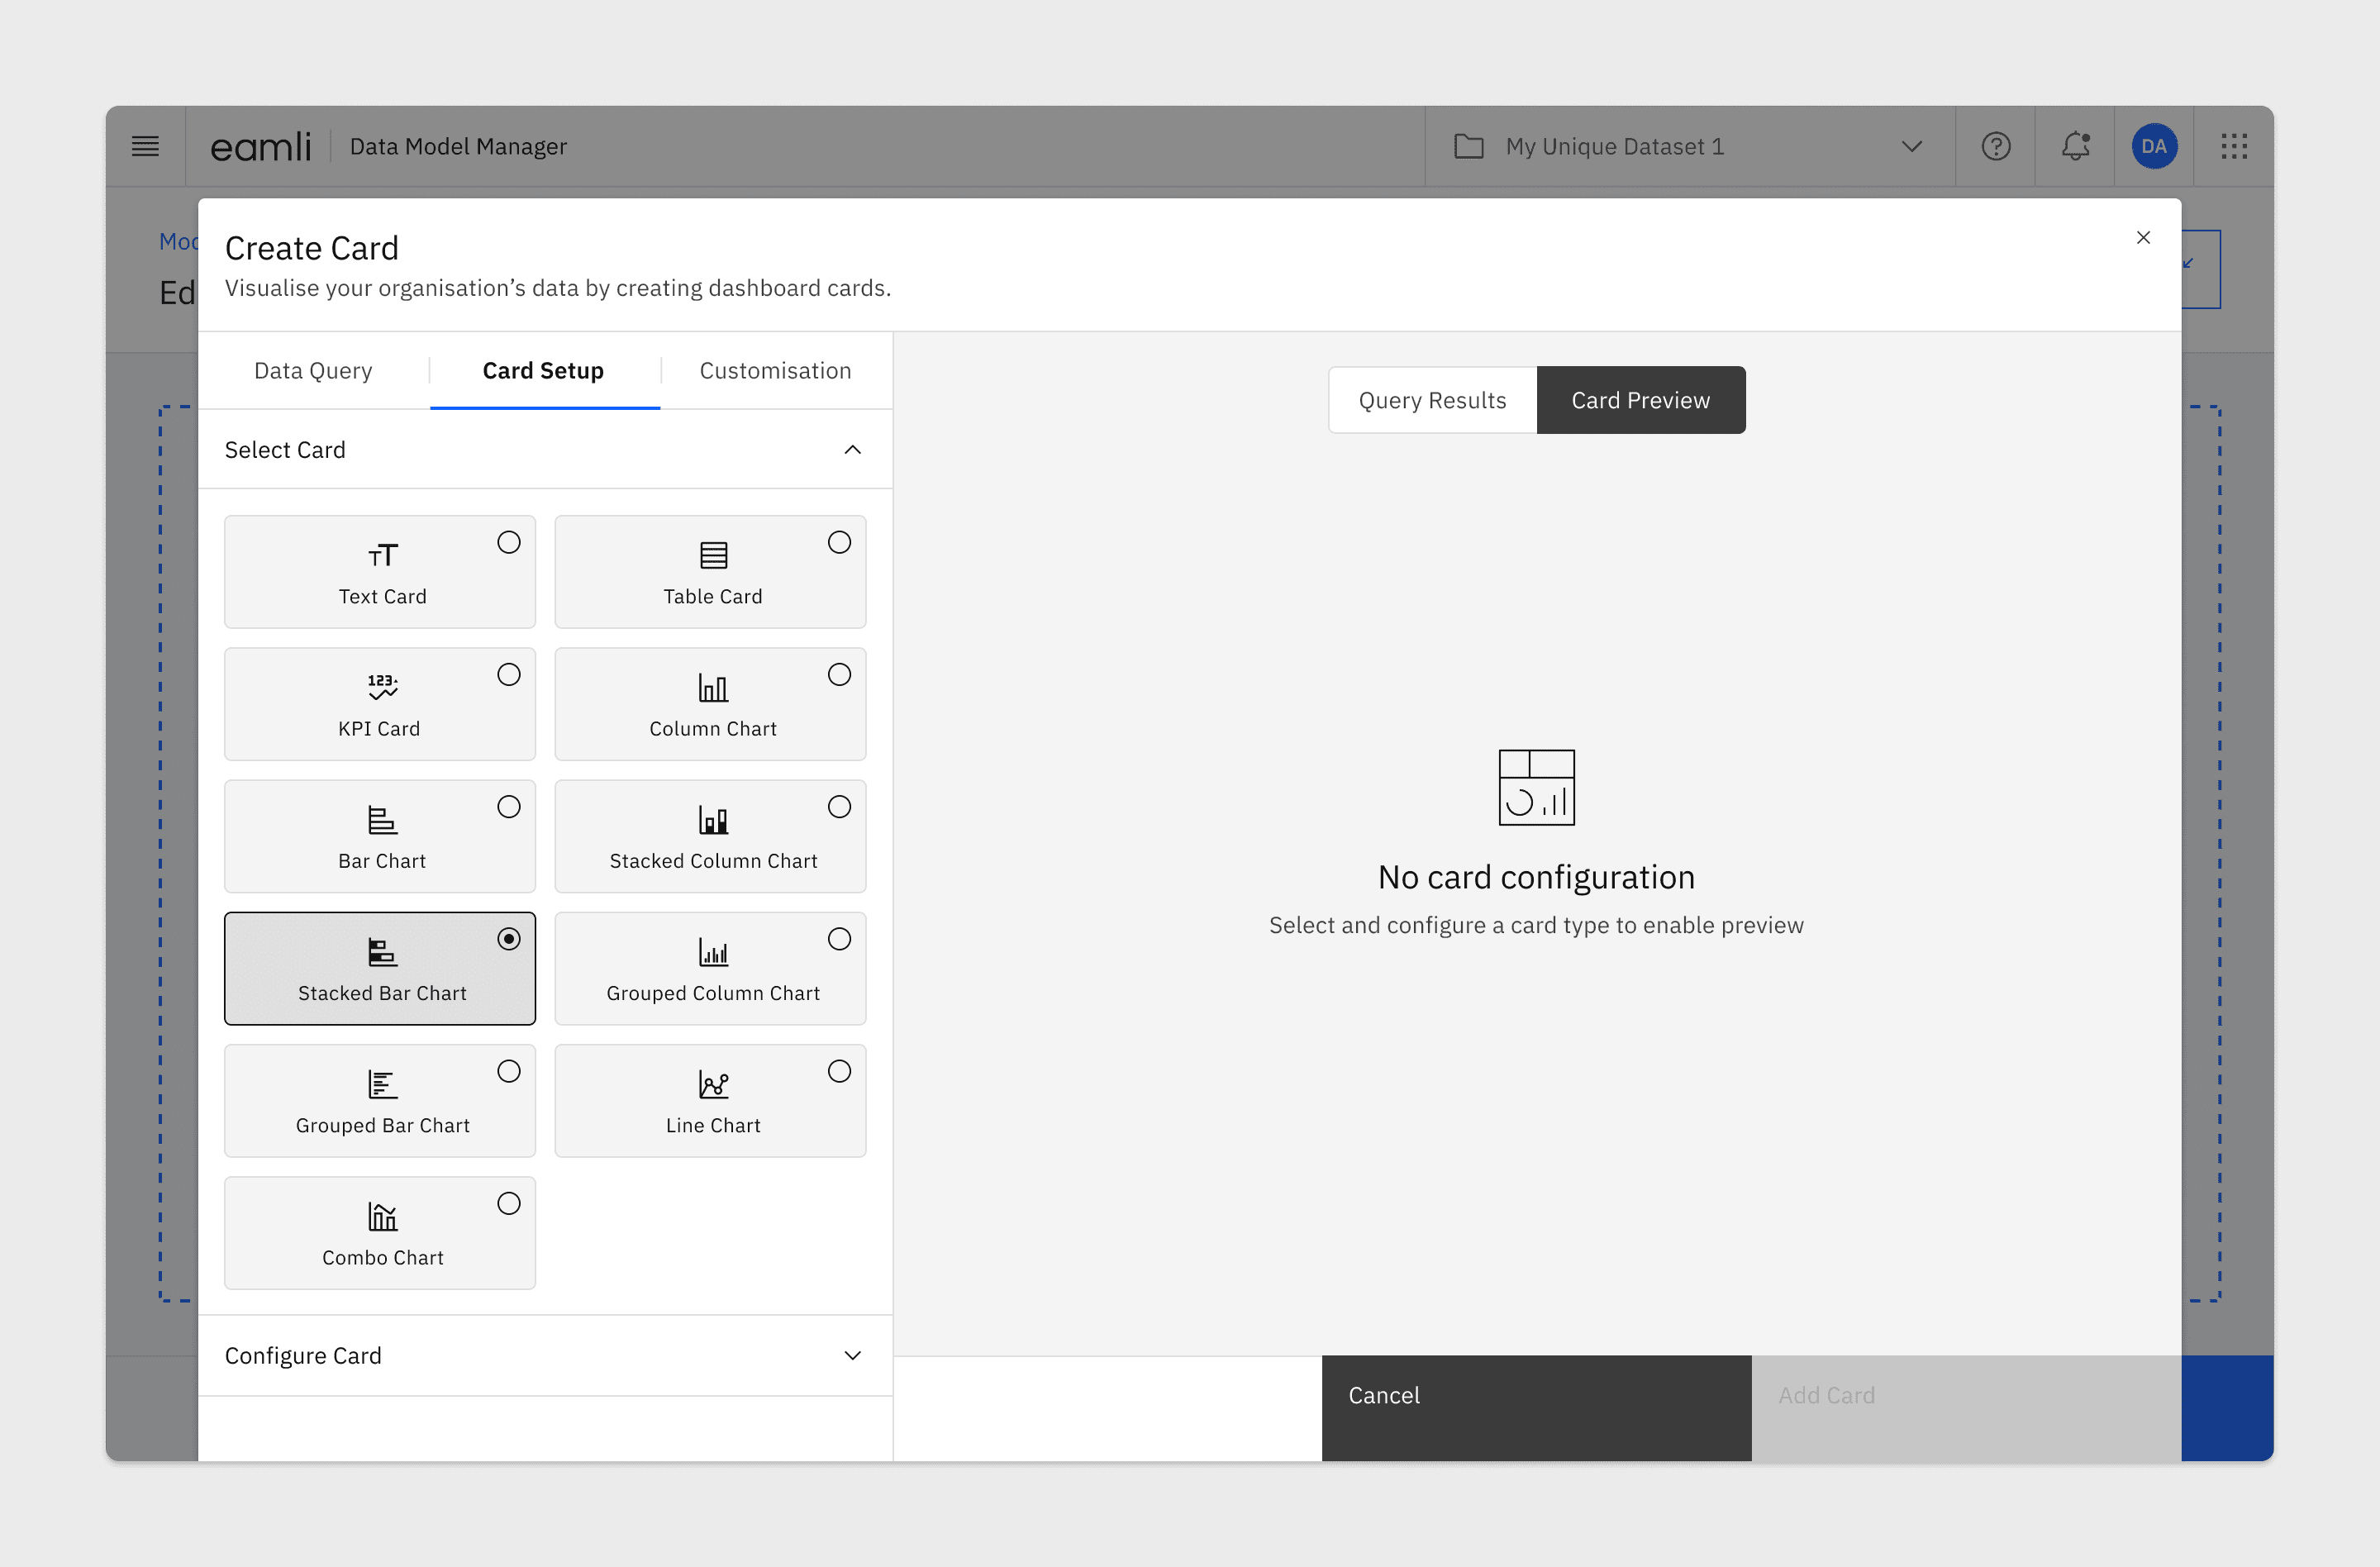
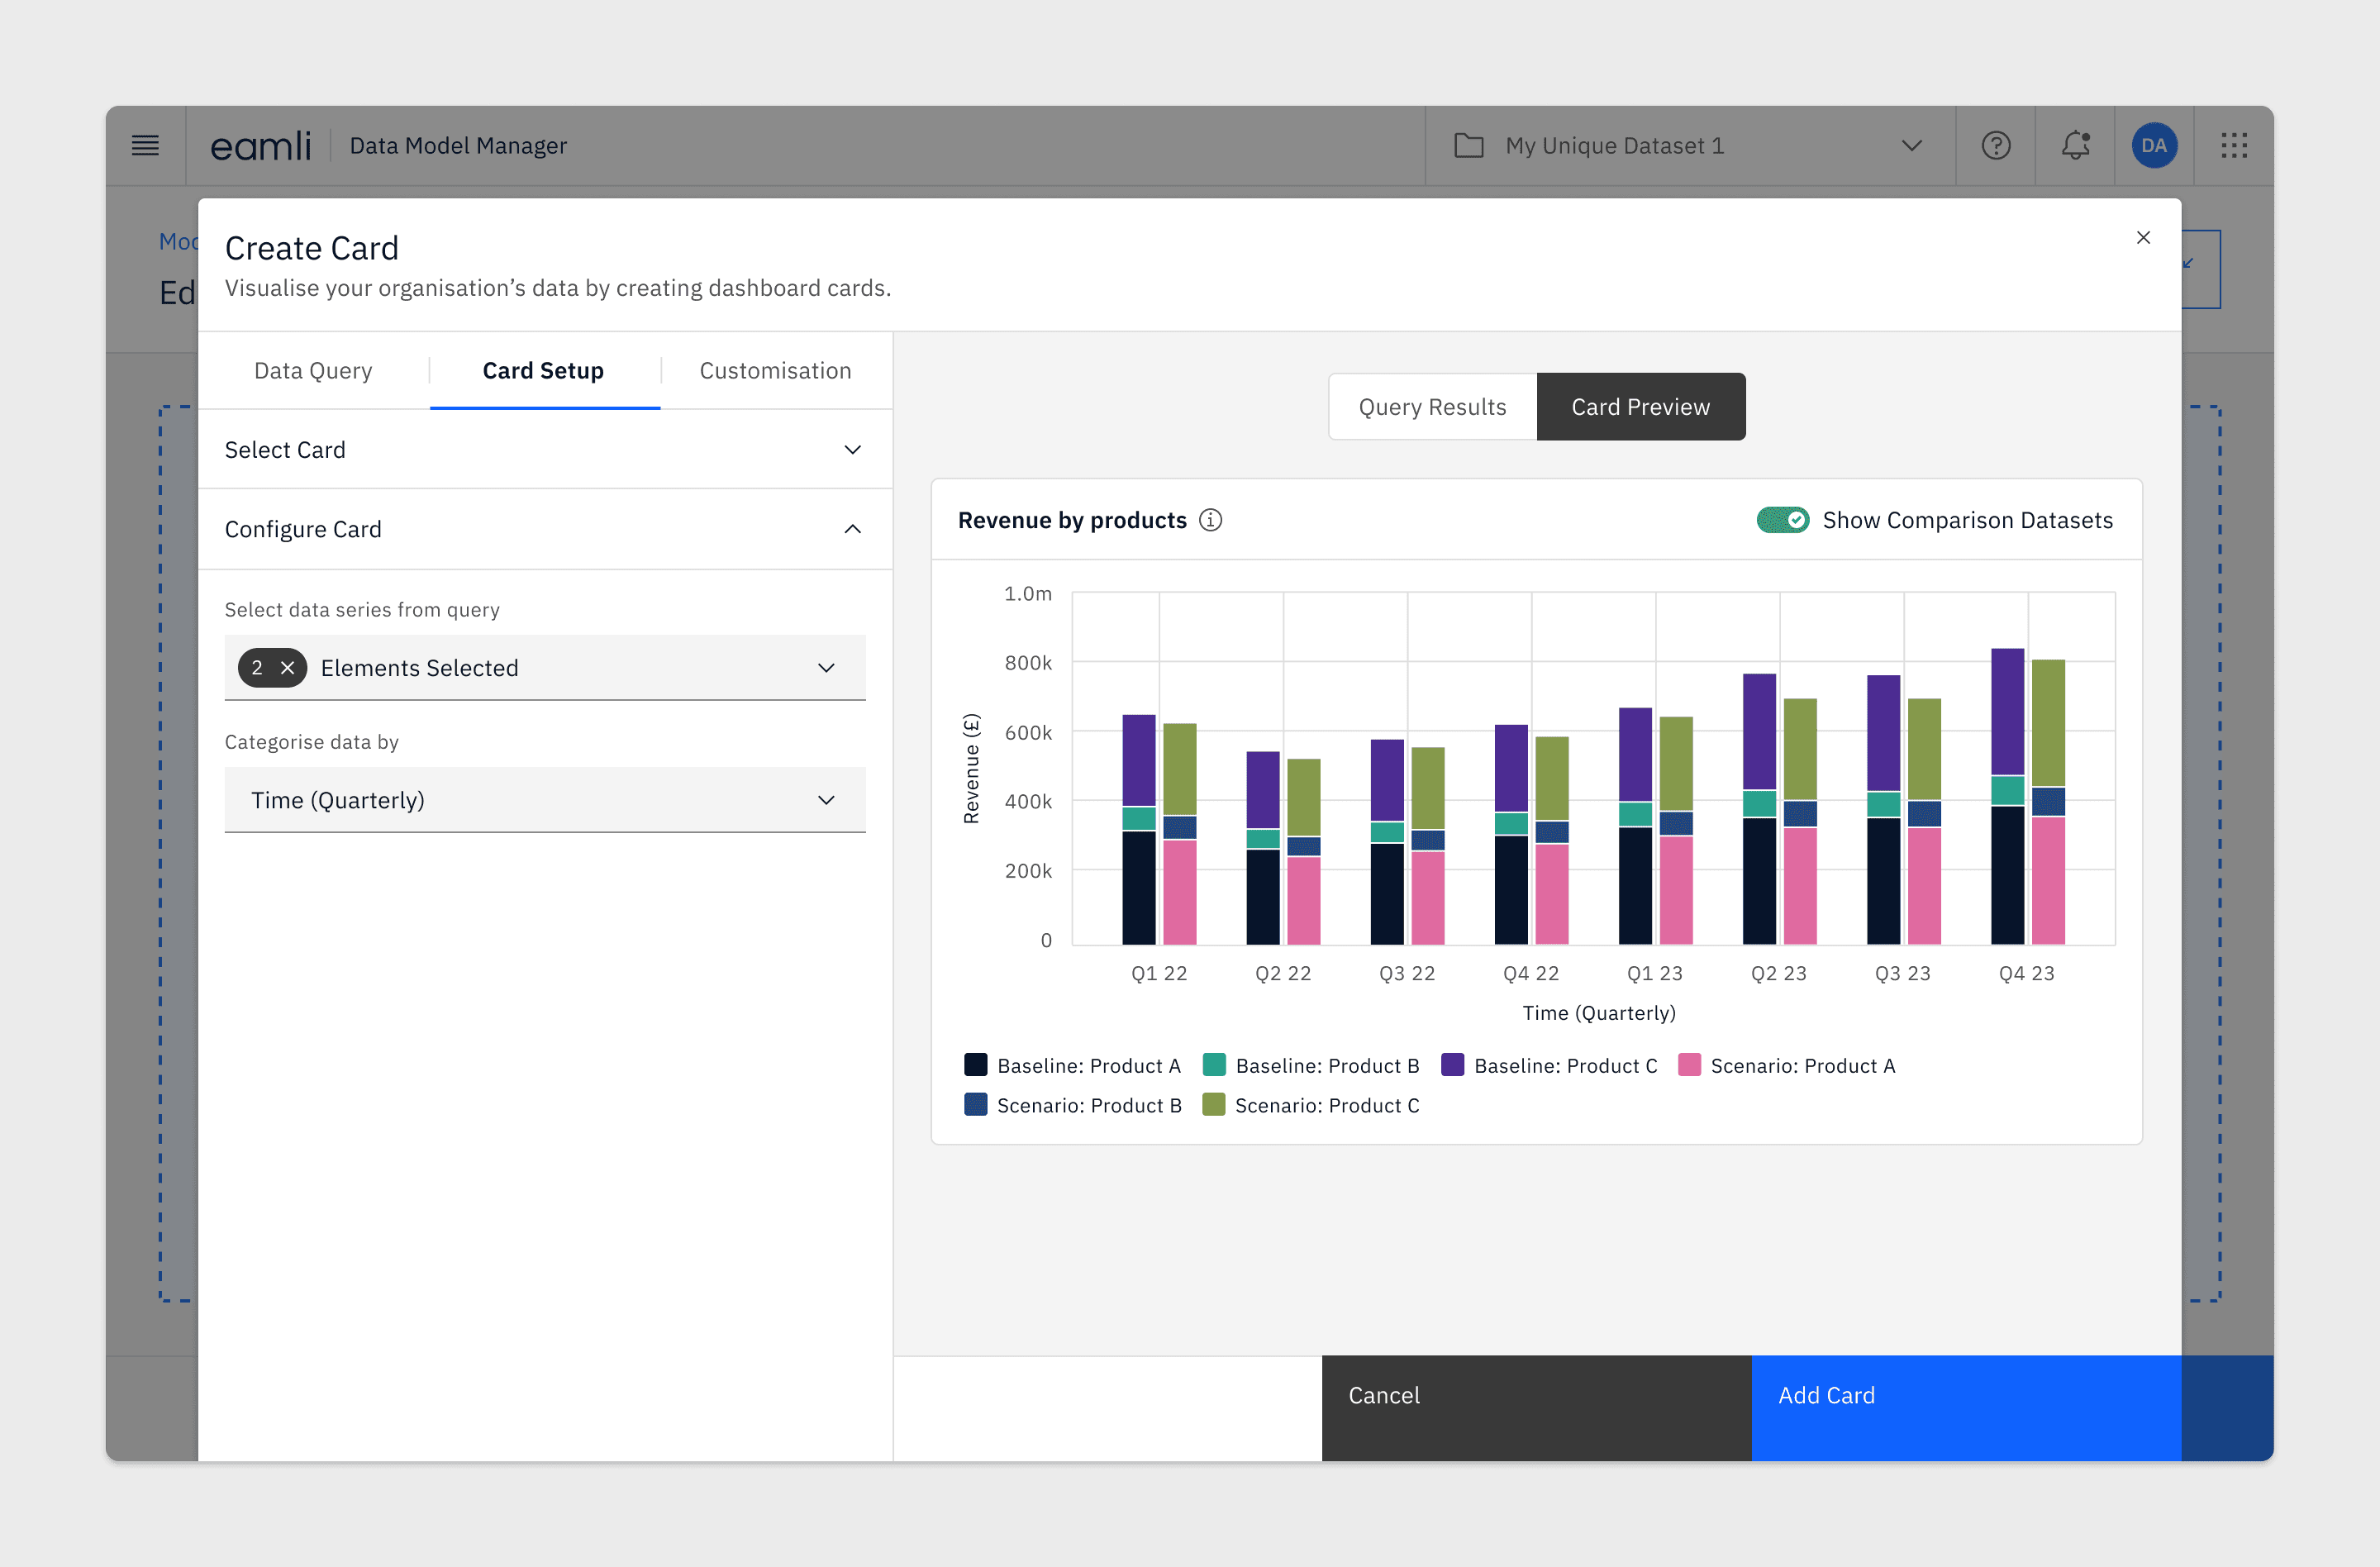
Once you’ve created a data query, you can move on to selecting and configuring a dashboard card type. To get started, choose the card type you wish to add (eg: Bar Chart, Table, etc). Once a card type has been selected, inputs will be revealed, allowing you to map your data from your query to your dashboard card.
Card Customisation
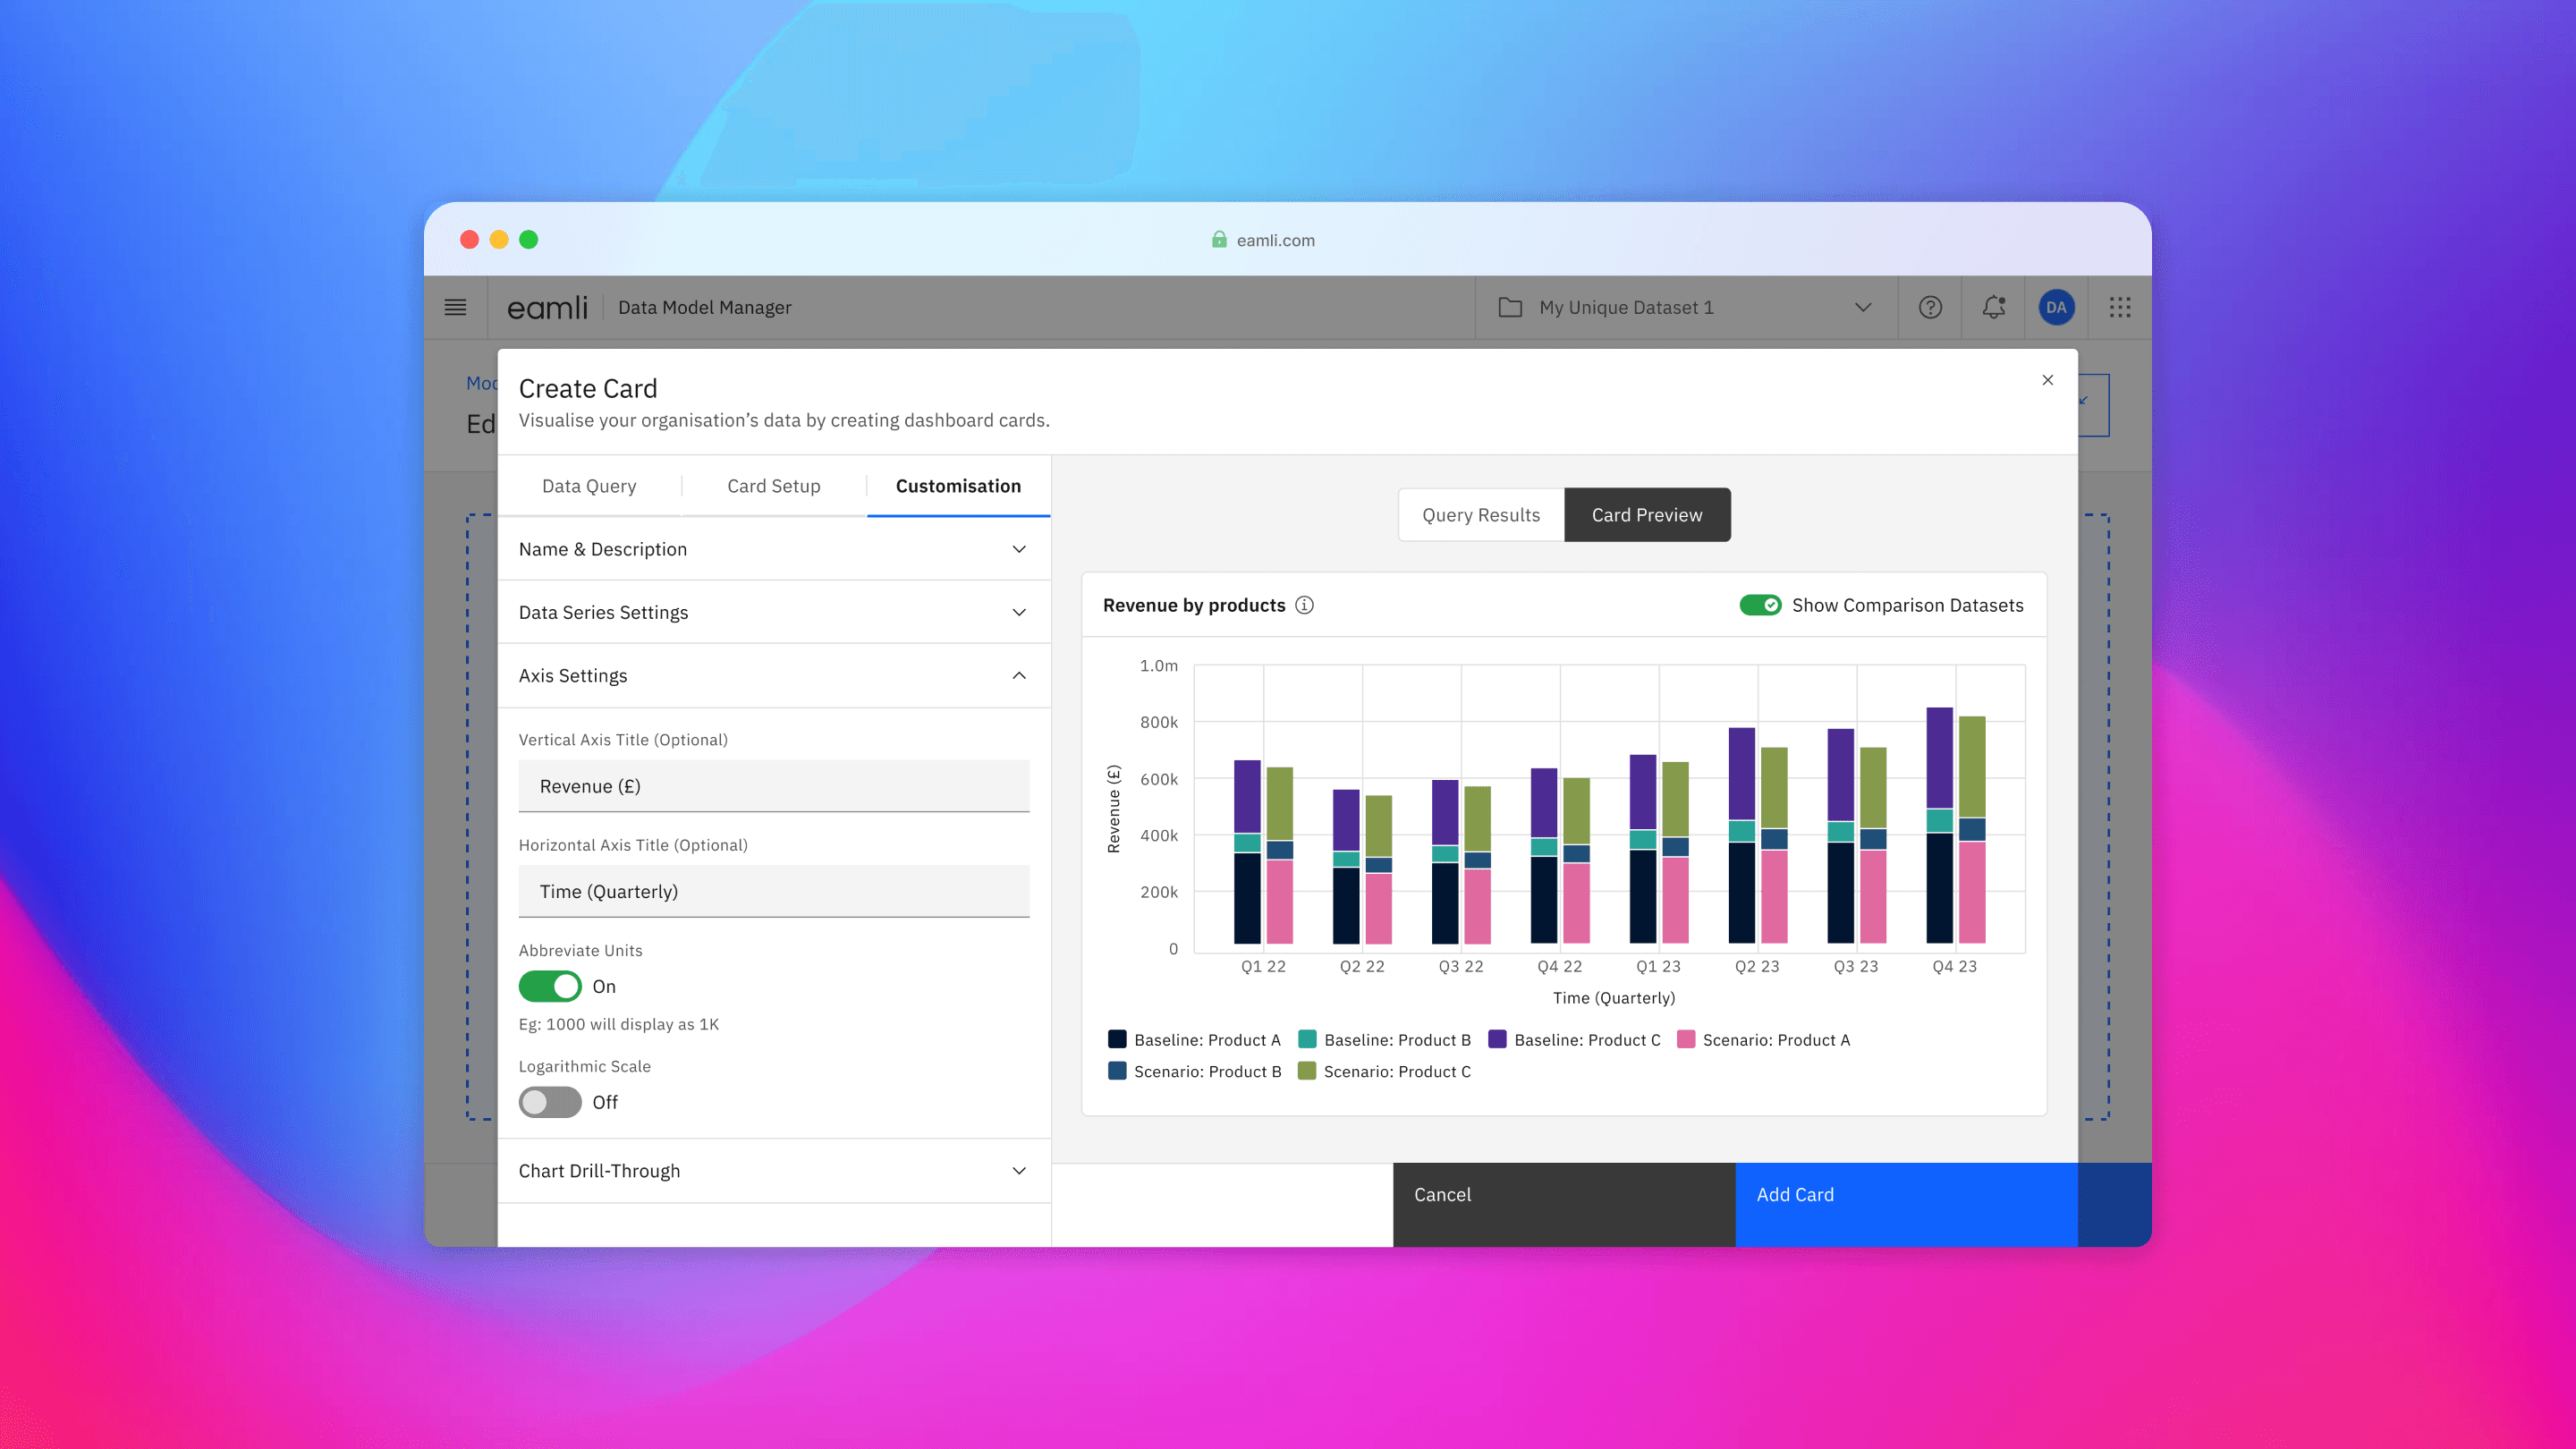
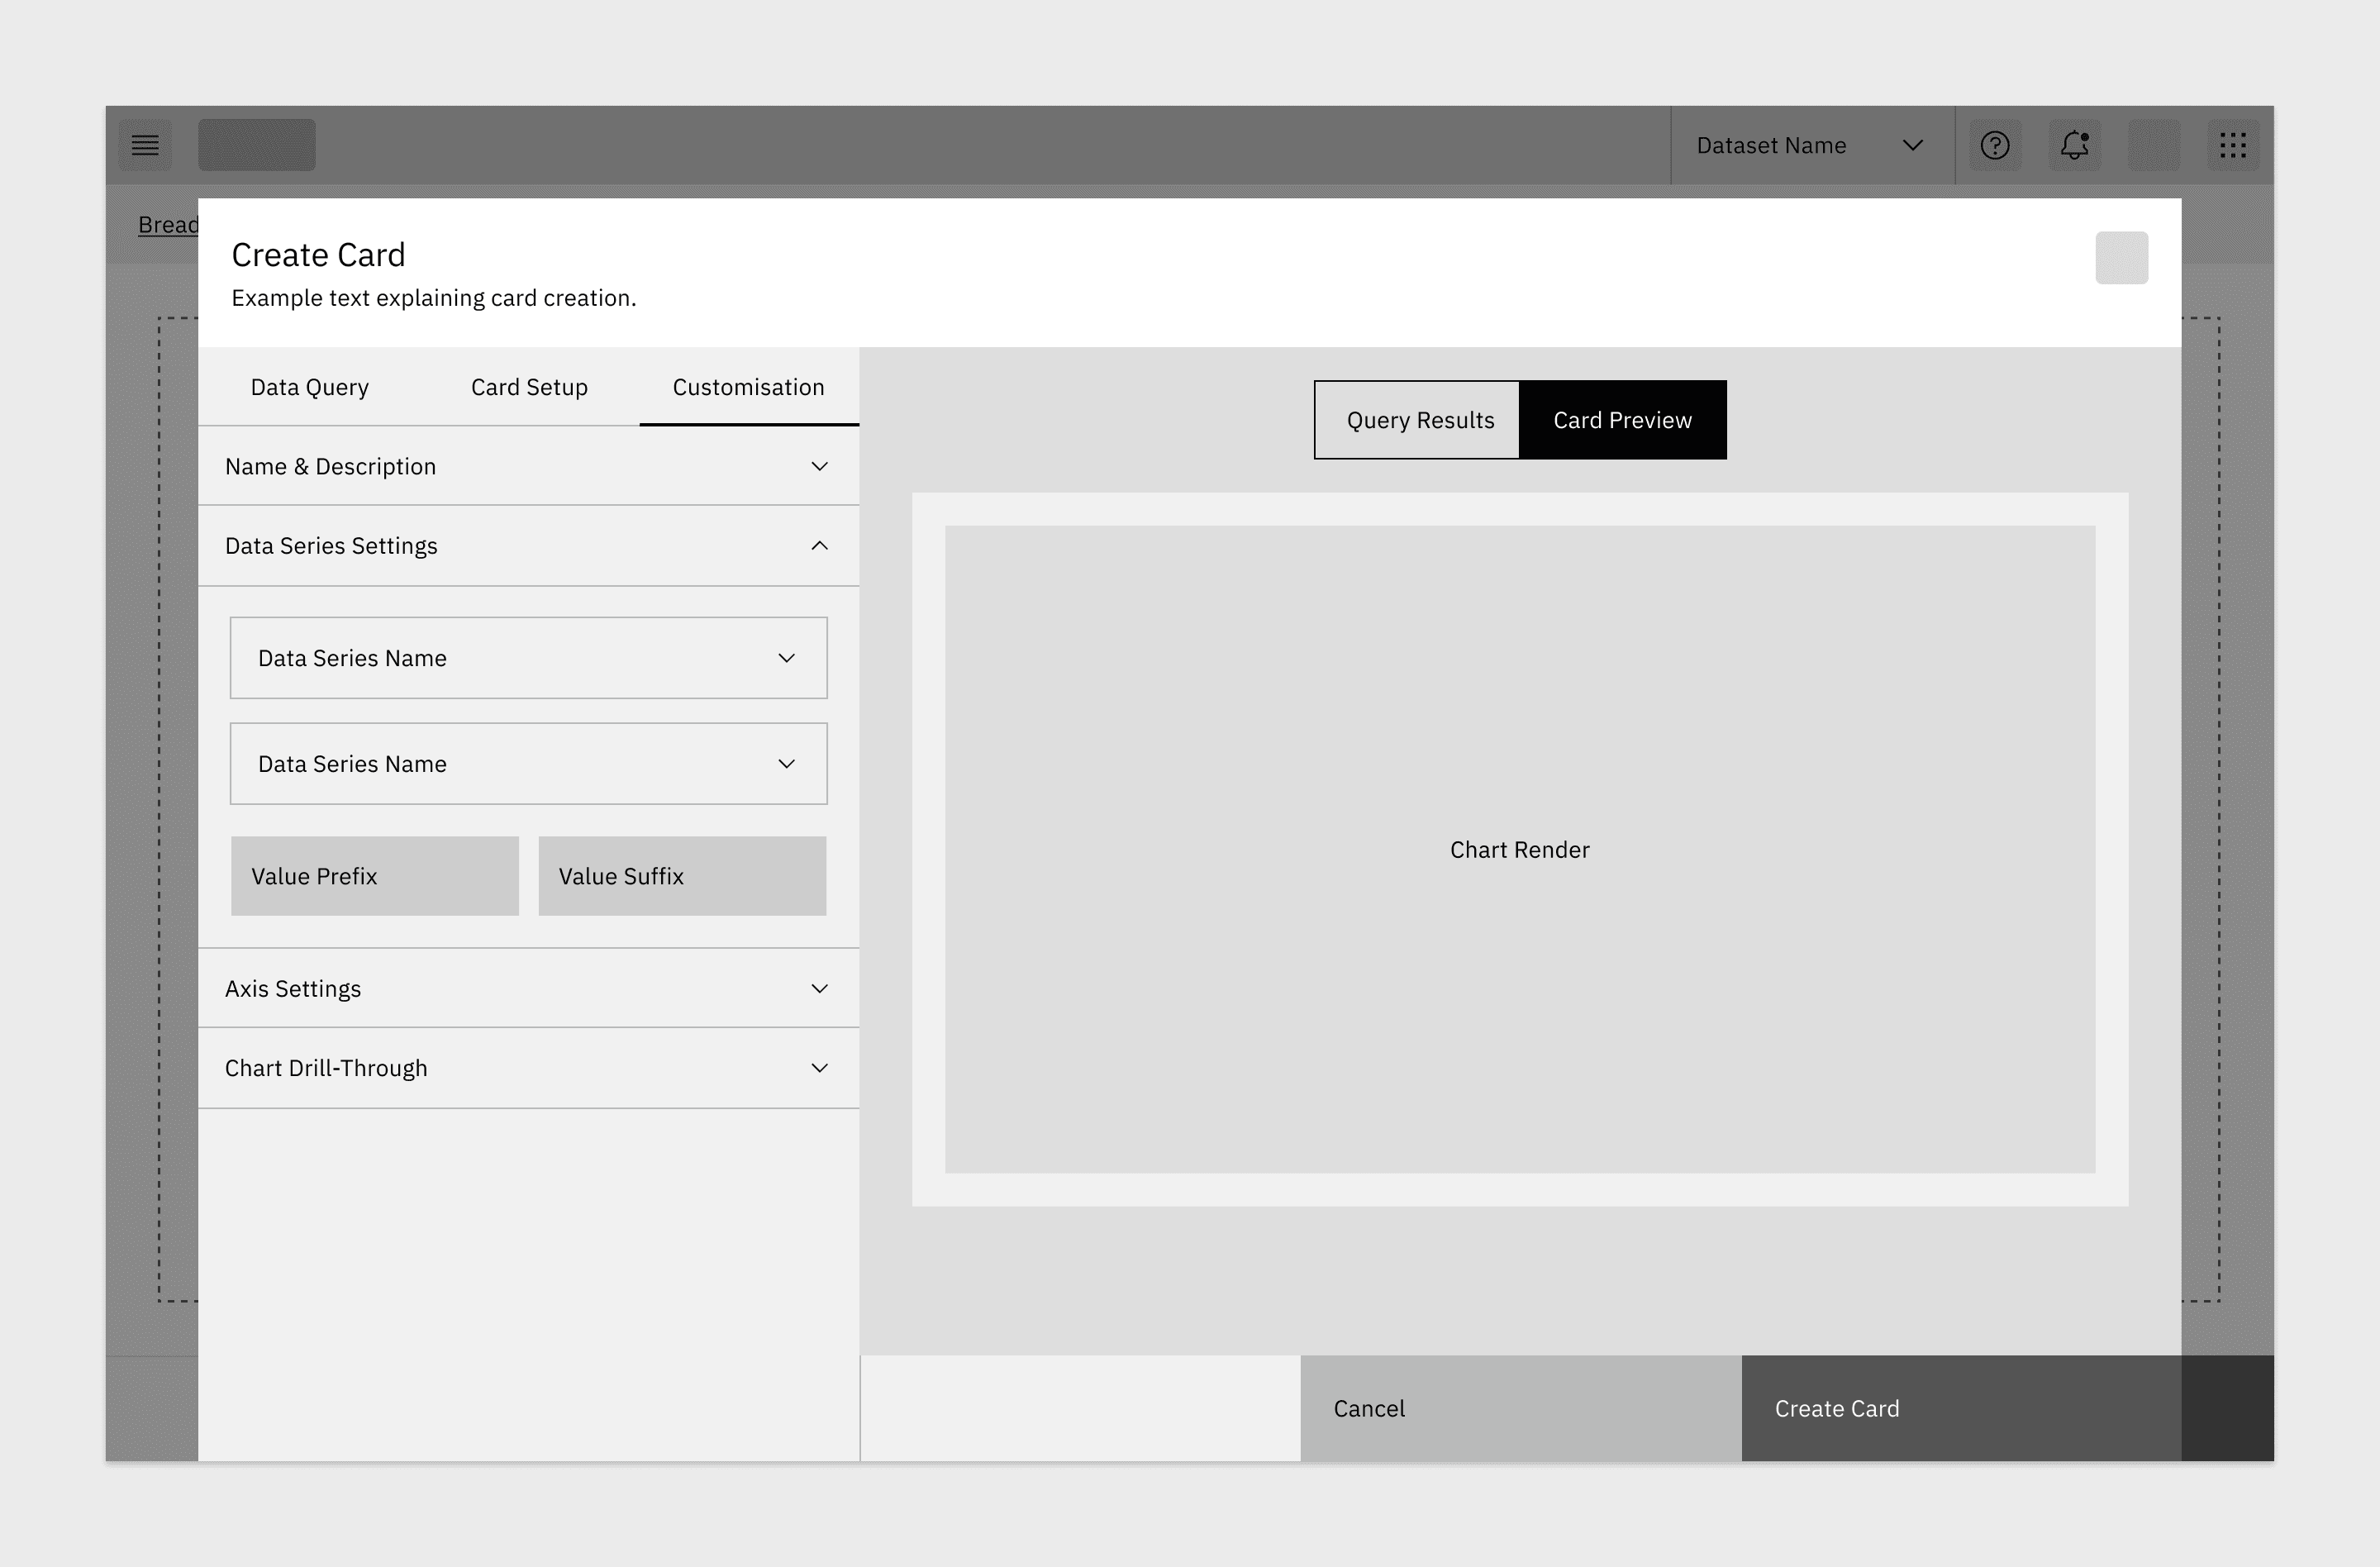
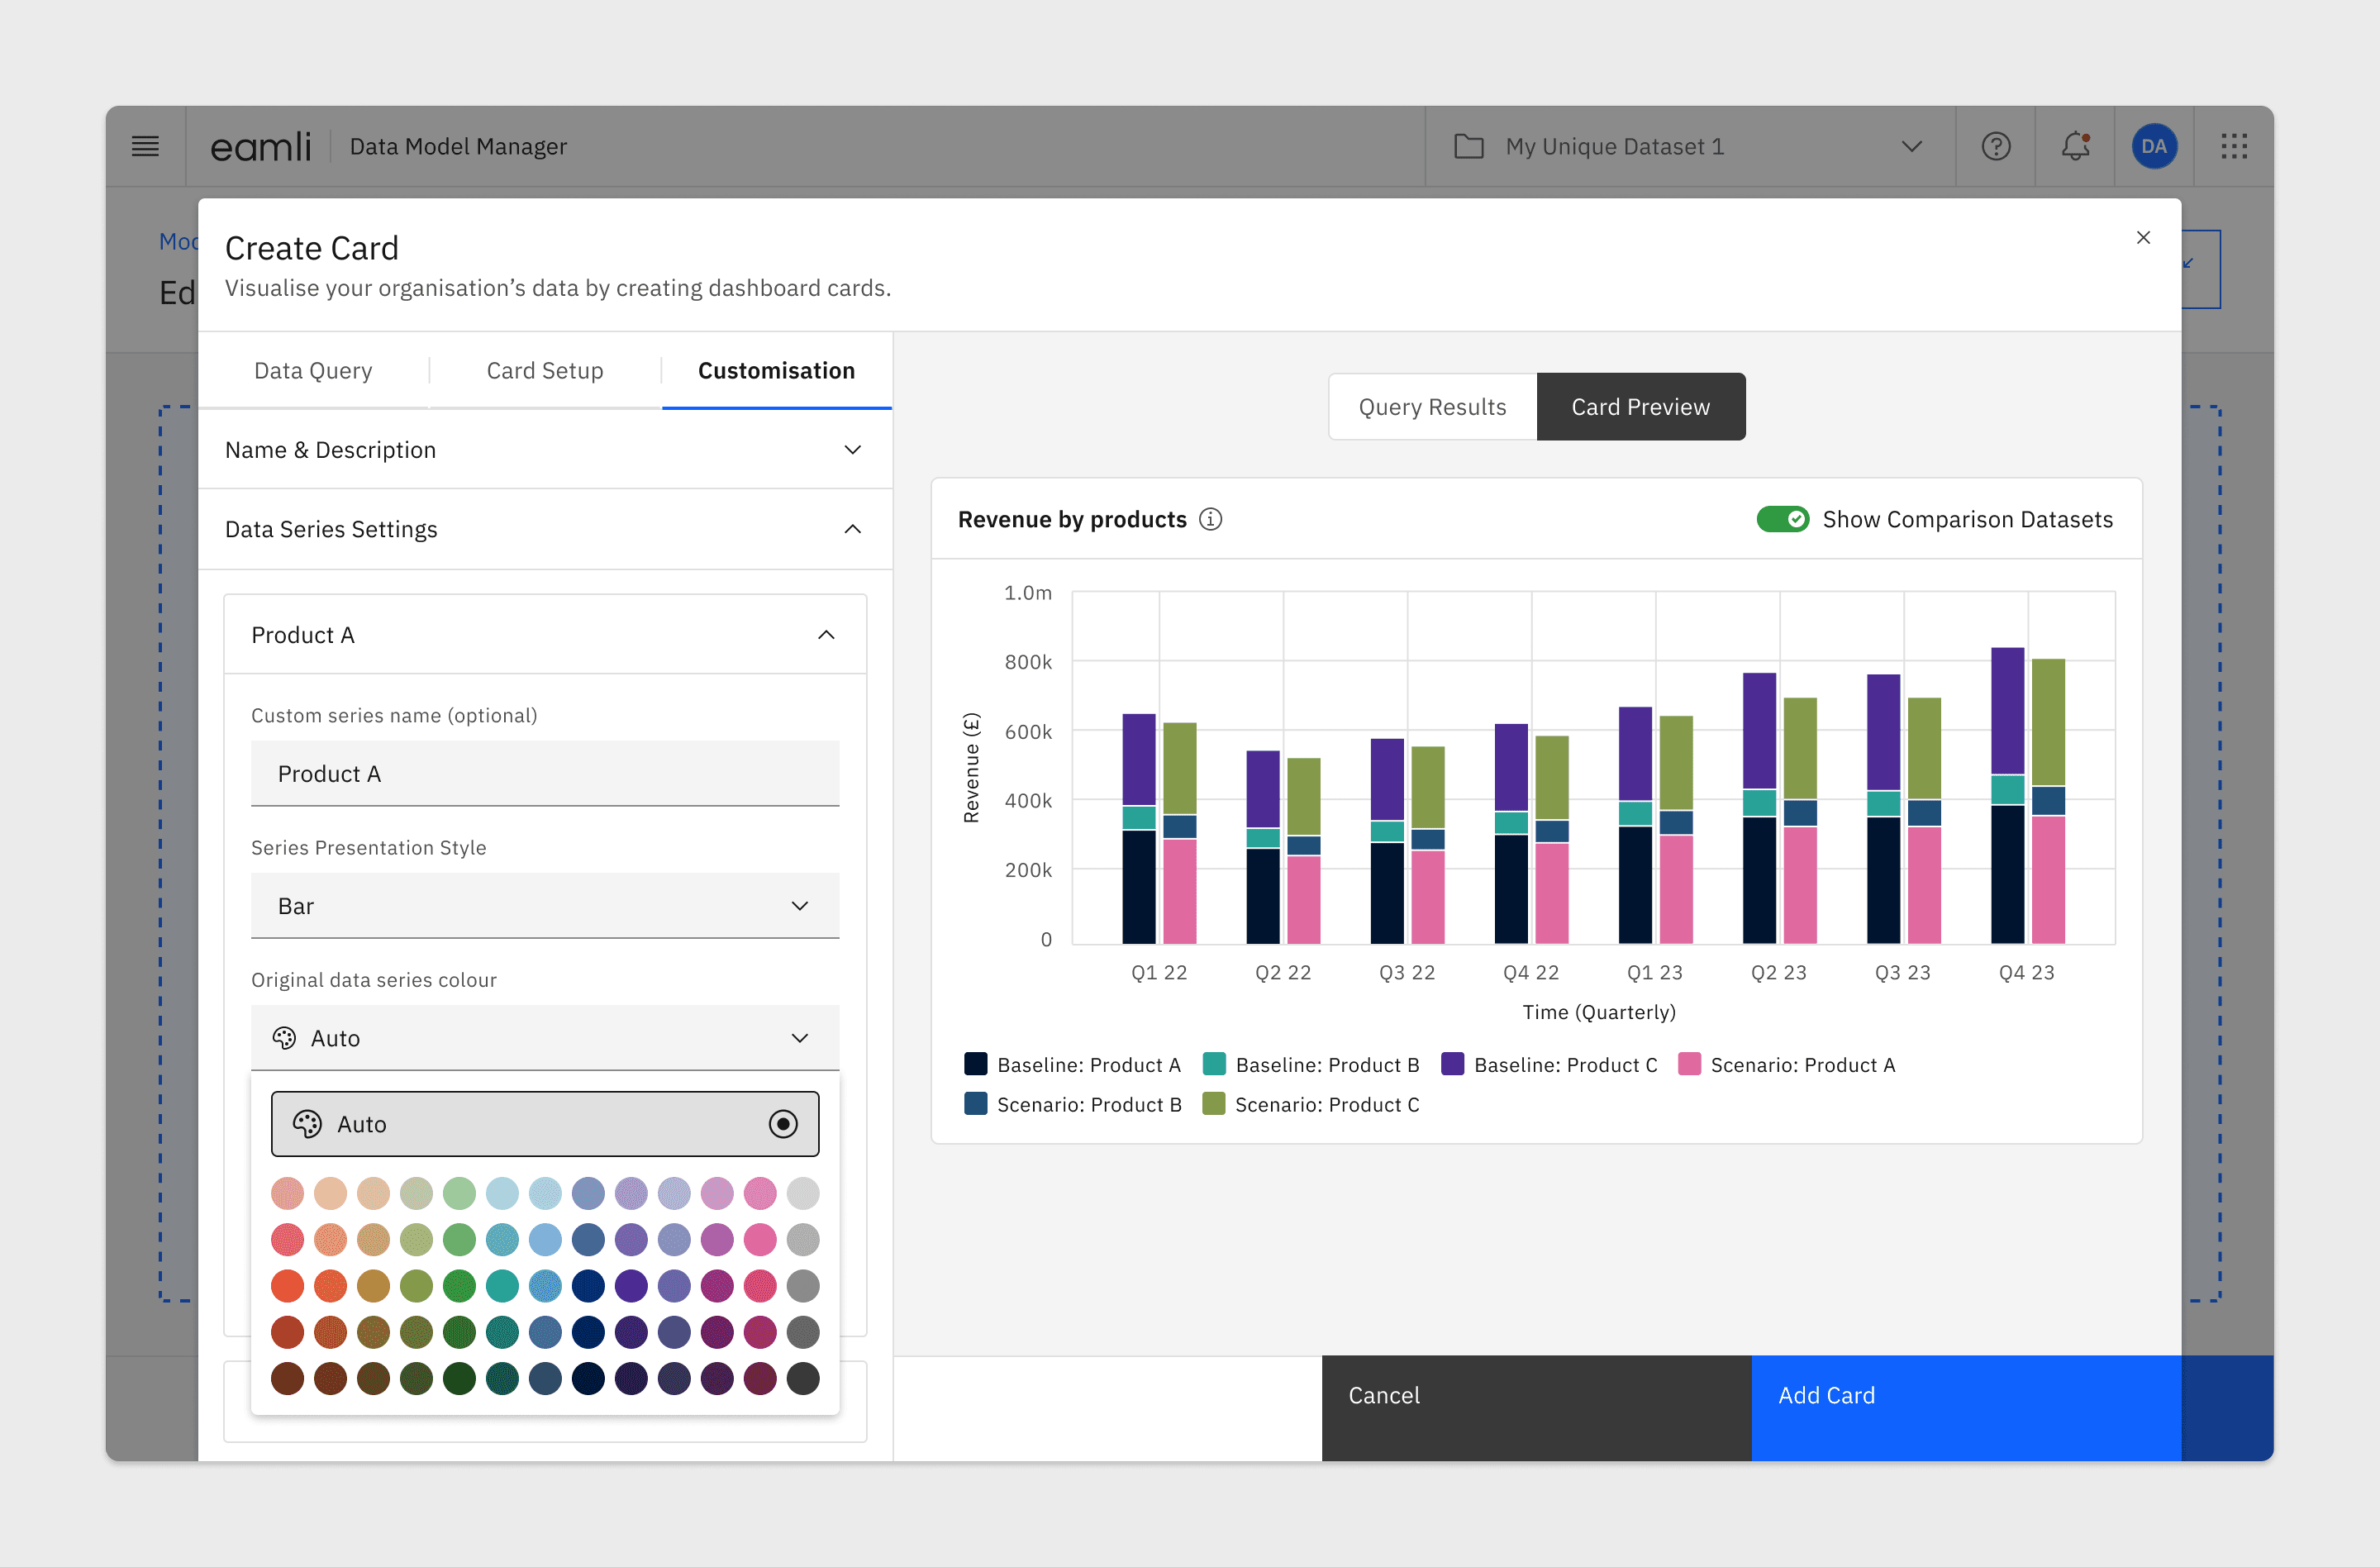
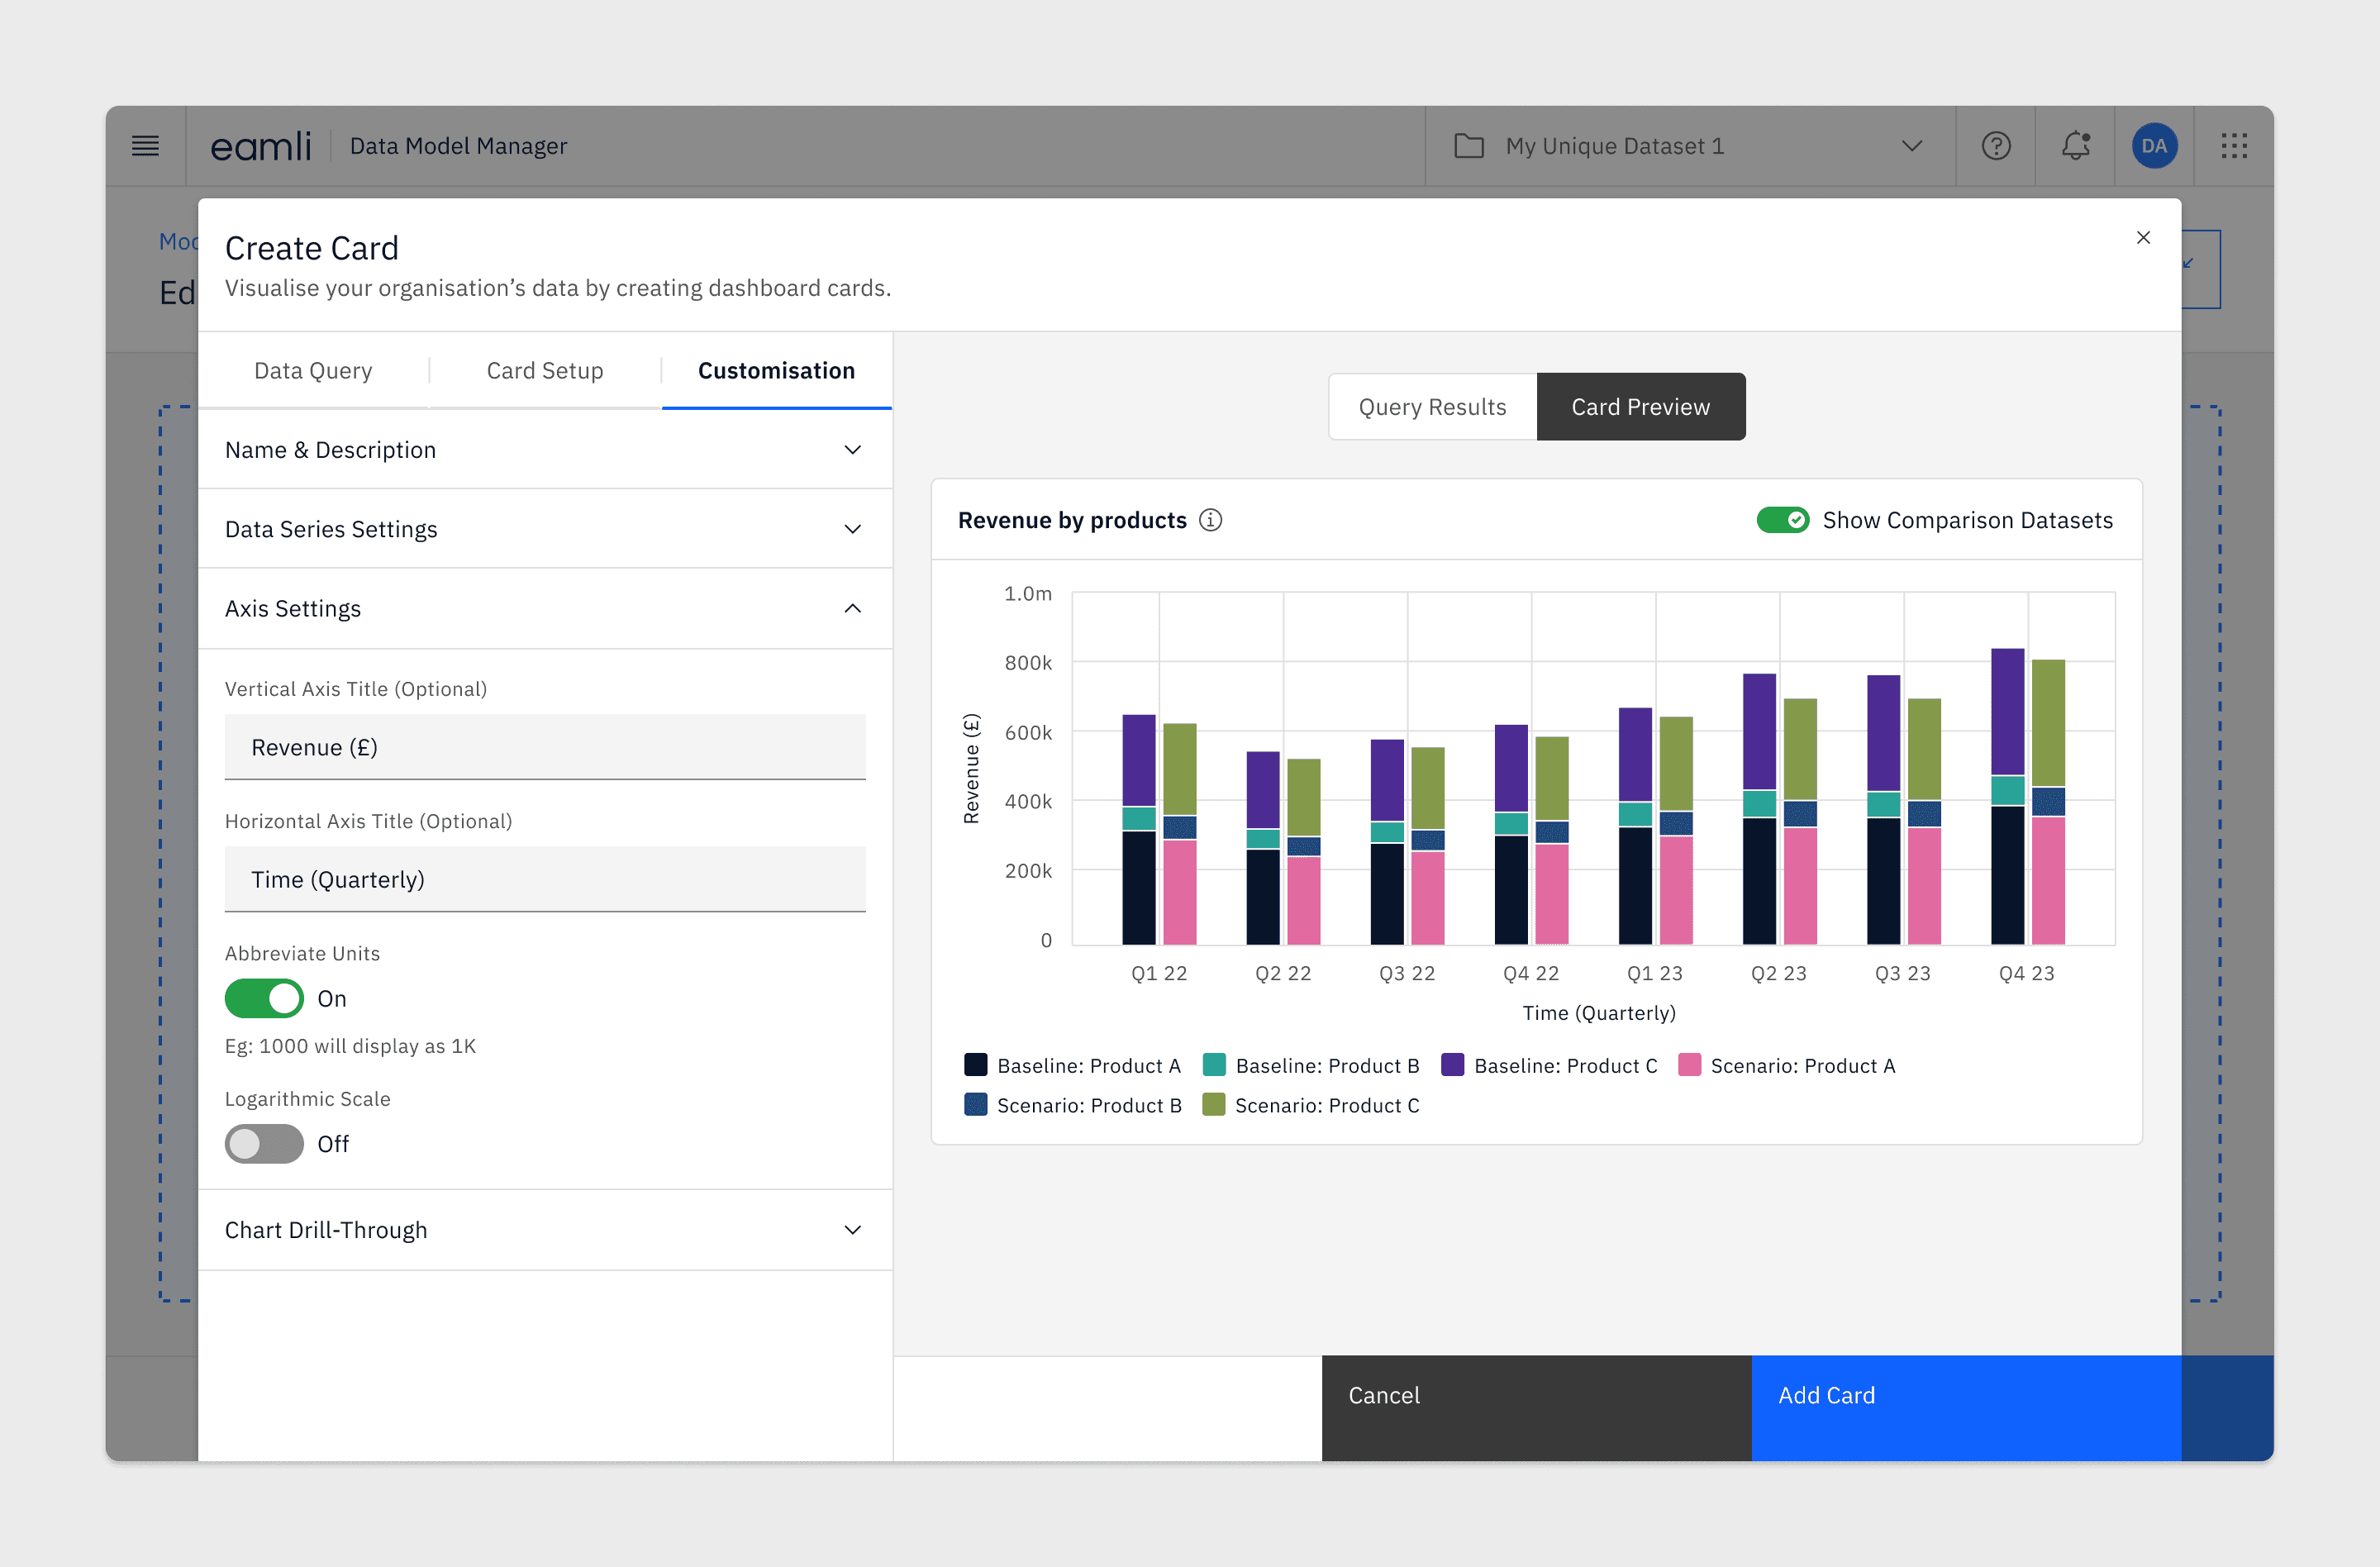
After connecting your data to your card, you can begin customising it to your preferences. Eamli takes a less-is-more approach to customisation so that our users won’t be overloaded with too many options. In order to keep our charts accessible we have chosen to exclude options that allow users to customise font sizes and text colours. Instead, we focus on customisation options that help give meaning to the data being displayed. For instance, you can provide custom labels for datasets that might inherit unclear names from their data model.
Outcome & Next Steps
We've been getting a ton of positive feedback from our users following the release of the new dashboard and card creation flows. People are loving the new features, especially the customisation options! Particularly those that help modellers present their findings in a way that decision-makers can truly understand. Based on the feedback received during these testing sessions, we have already identified areas for future improvement, including the introduction of additional customisation options and card types.
Eamli’s broader success
Currently, Eamli is still an early-stage product that is continuing to develop and improve. However, despite its early-stage status, we have still managed to achieve some amazing things:
Eamli has captured the interest of tech giants including IBM which has now partnered with Eamli. Through this partnership, IBM has now listed Eamli as one of its IBM Cloud Pak Partner Solutions.
The UK government identified Eamli as a tool that could help them with long-term procurement decision-making. This led to a trial of its use throughout a branch of the UK government, which was deemed a success. Eamli is now being considered for wider cross-government uses.
Eamli became an award-winning product after winning the Digital Innovation of the Year Award at the Digital DNA Awards.
